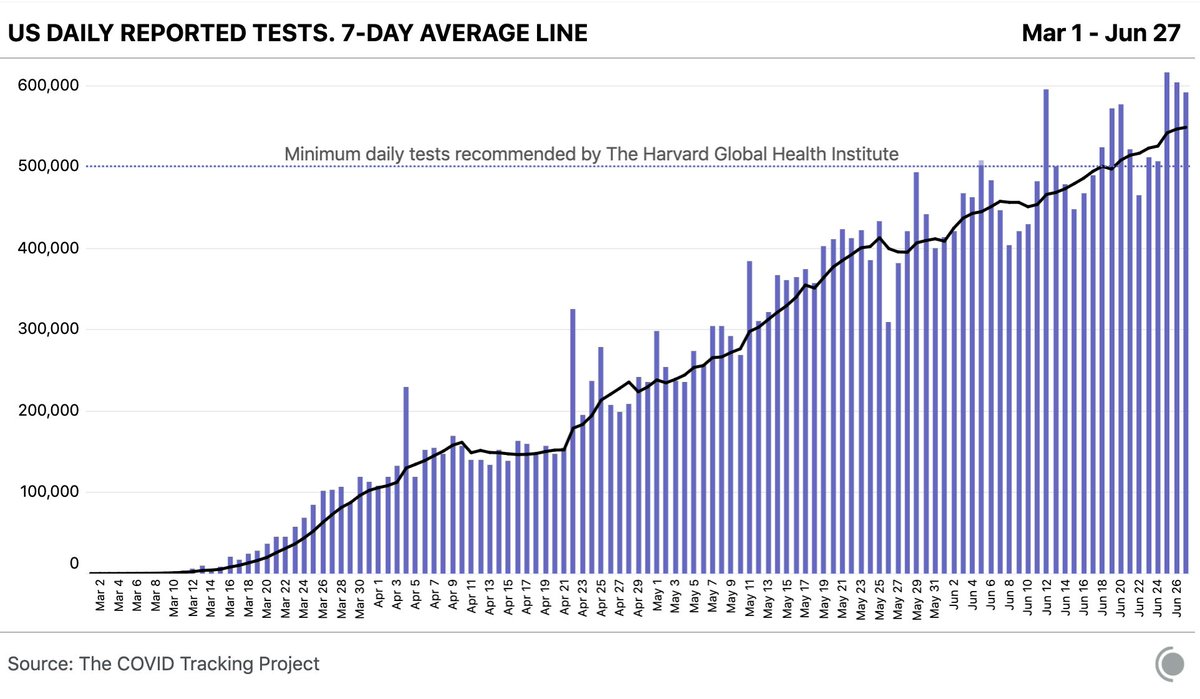
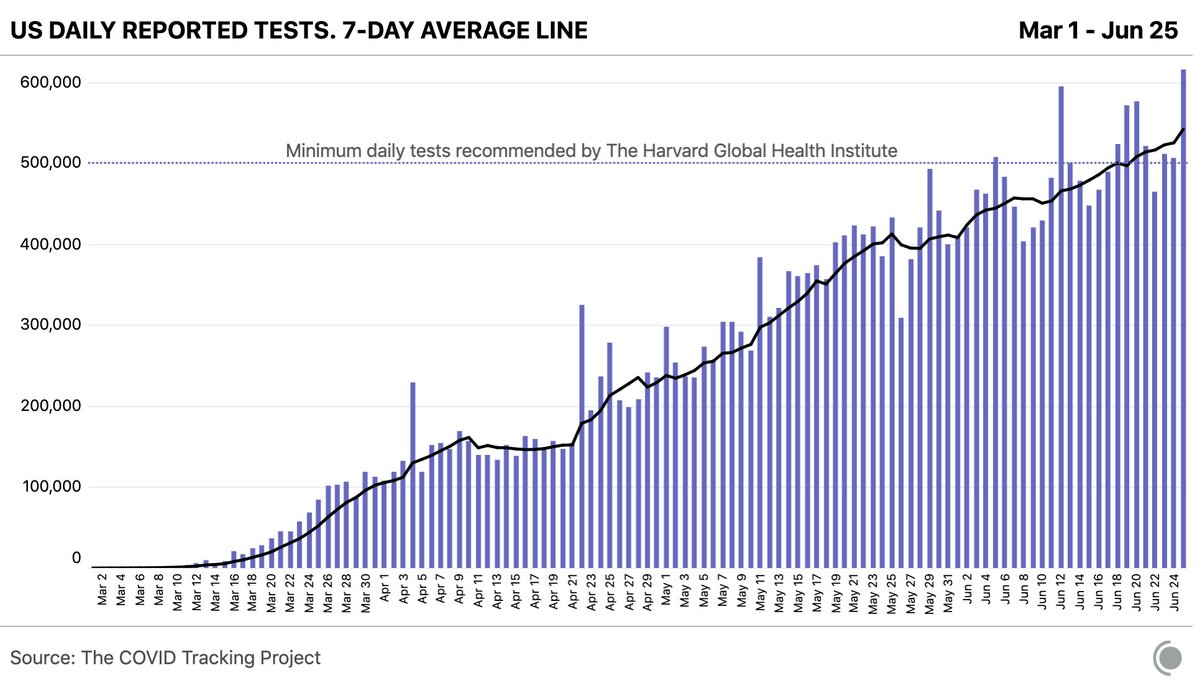
Our daily update is published. We’ve now tracked 29.2 million tests, up 640k from yesterday, by far the biggest testing day yet.
States had never reported more than 594k daily tests.
For details, see: covidtracking.com
States had never reported more than 594k daily tests.
For details, see: covidtracking.com
There are important caveats in today's data:
New Jersey reported 1800+ probable deaths from previous days. That number is in our API, but we will exclude it from charts here.
We think we'll be able to get historical data from NJ in order to properly assign those deaths.
New Jersey reported 1800+ probable deaths from previous days. That number is in our API, but we will exclude it from charts here.
We think we'll be able to get historical data from NJ in order to properly assign those deaths.
For a month, we've been tracking probable and confirmed deaths separately on out backend and should have those columns public soon.
We had hoped to have these columns public sooner, but it's turned out to be extremely difficult to do right.
We had hoped to have these columns public sooner, but it's turned out to be extremely difficult to do right.
2. Wisconsin reported 2.8k probable cases today from previous days. They are also in the API, but excluded from the charts presented here.
As with NJ, we hope to be able to properly assign those probable cases to the right dates, too, with the state's help.
As with NJ, we hope to be able to properly assign those probable cases to the right dates, too, with the state's help.
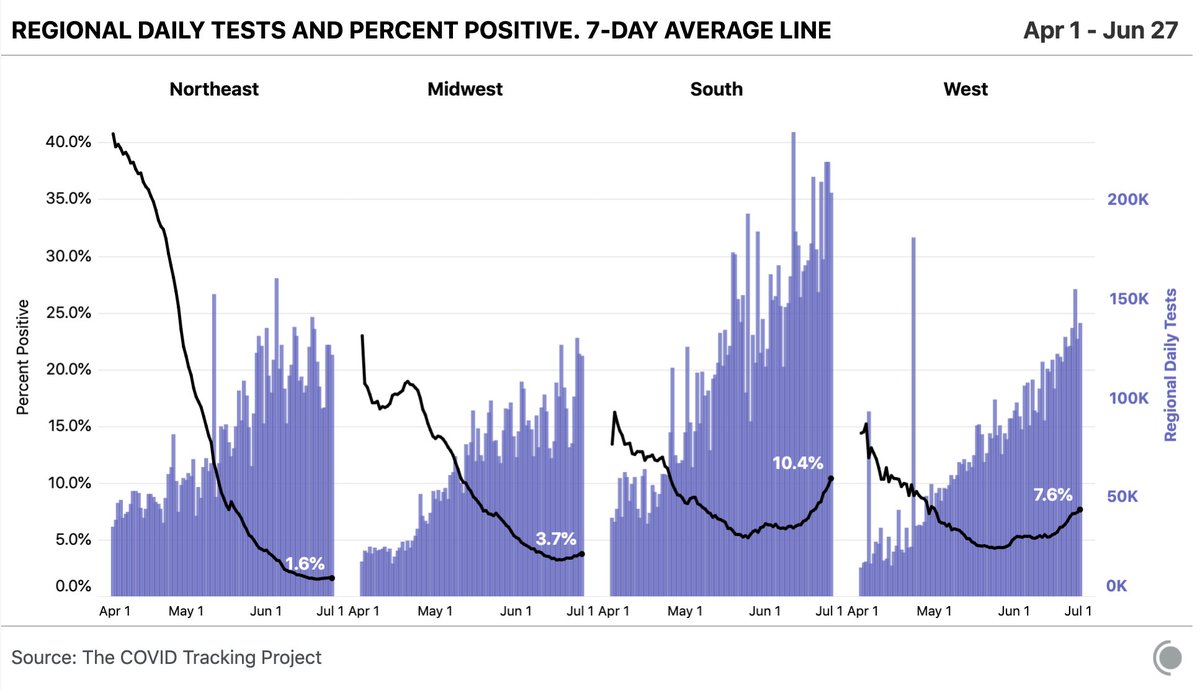
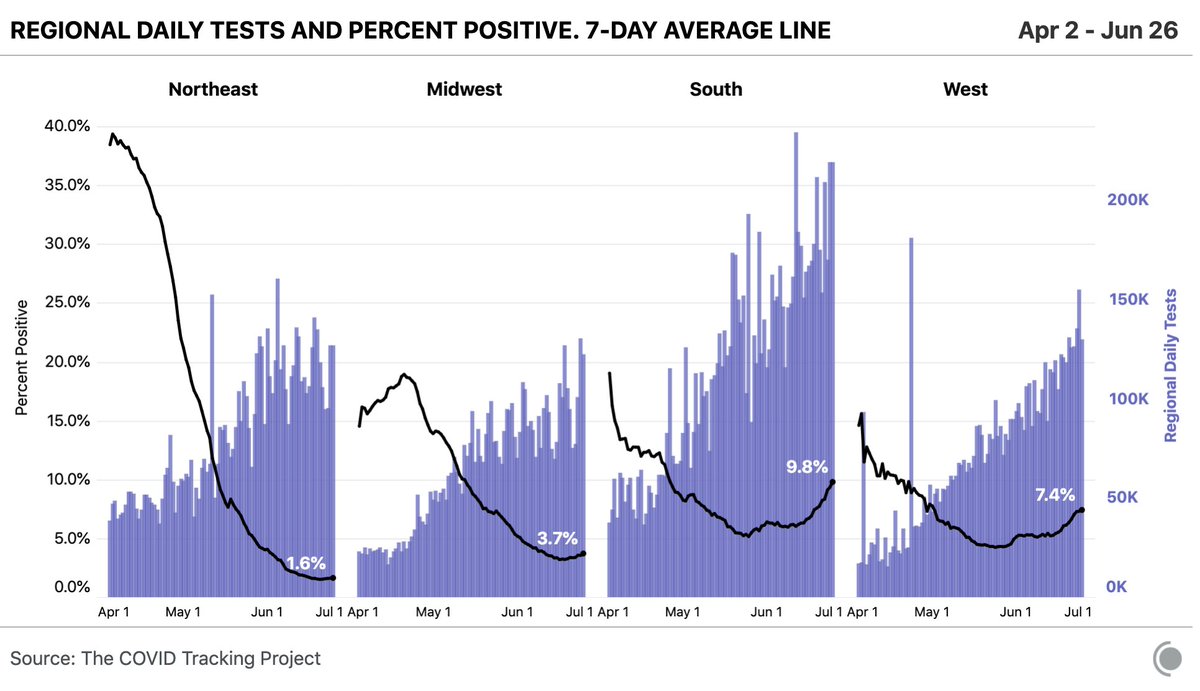
Returning to the numbers, it was a big testing day in every region, but there are meaningful differences in the percent positive across all four areas, as you can see.

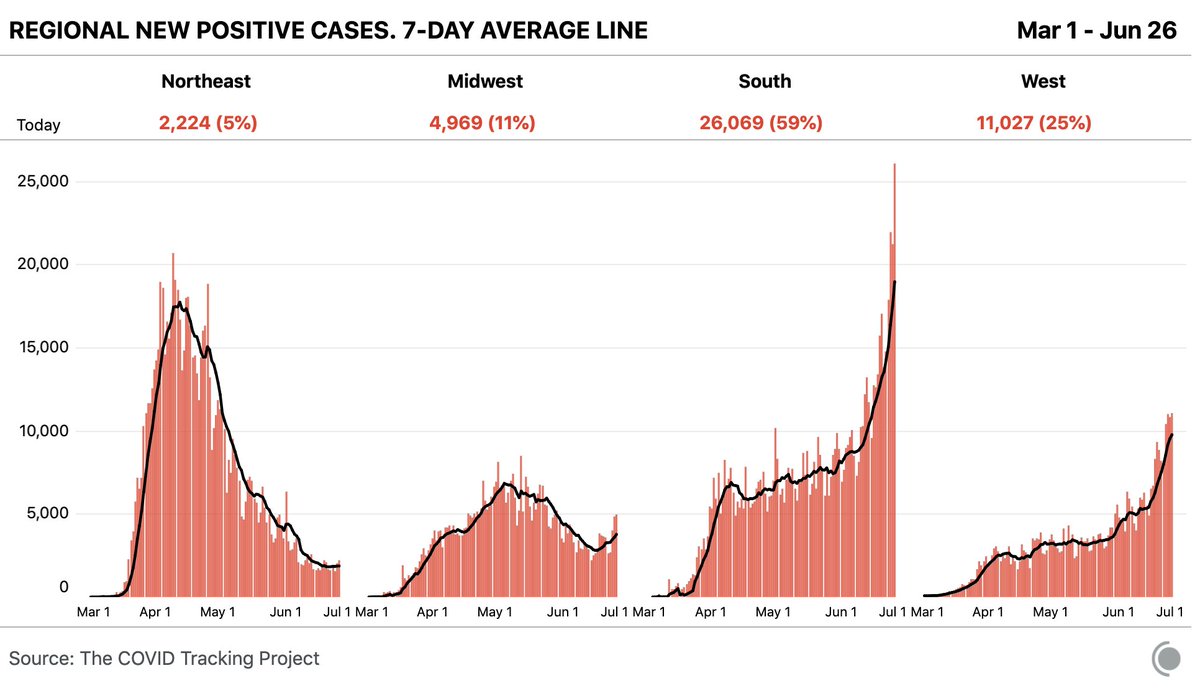
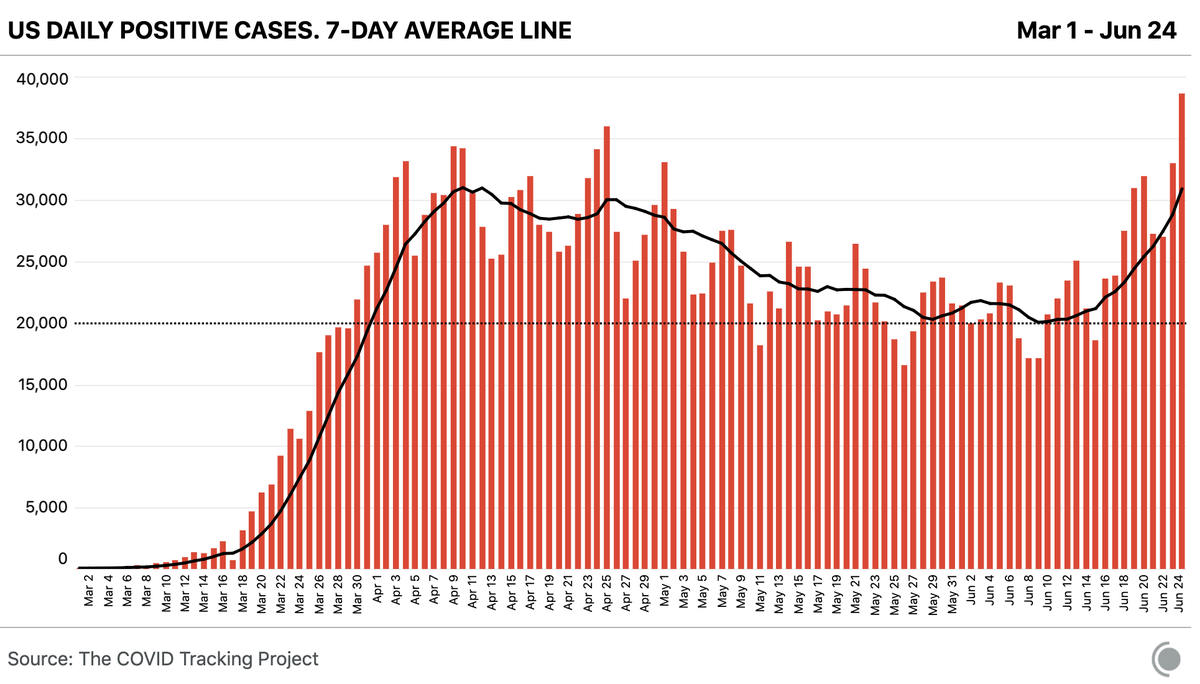
Even subtracting Wisconsin's probables, today marked a new record high for reported cases in the outbreak at just over 39k.

The regional picture looks much like yesterday, though the upward tick in the Midwest is more pronounced.

Mississippi, Alabama, South Carolina, North Carolina, Georgia, and Florida all reported more than 1000 cases today.

Here's a zoom in on those southern states.
(Florida does not report current hospitalizations.)
(Florida does not report current hospitalizations.)

Here's a quick focus on Ohio. The situation does not look as dire as some places, but the state is now seeing hospitalizations turn upwards, too.

Zooming back out, 15 states have now set their record for reported cases since June 19. All but one (Missouri) is in the South and West.
(And we know some people do classify MO in the South.)
(And we know some people do classify MO in the South.)

The 7-day average of COVID-19 deaths is now 560.
But with this many cases piling up, it seems unlikely to keep falling for much longer.
But with this many cases piling up, it seems unlikely to keep falling for much longer.

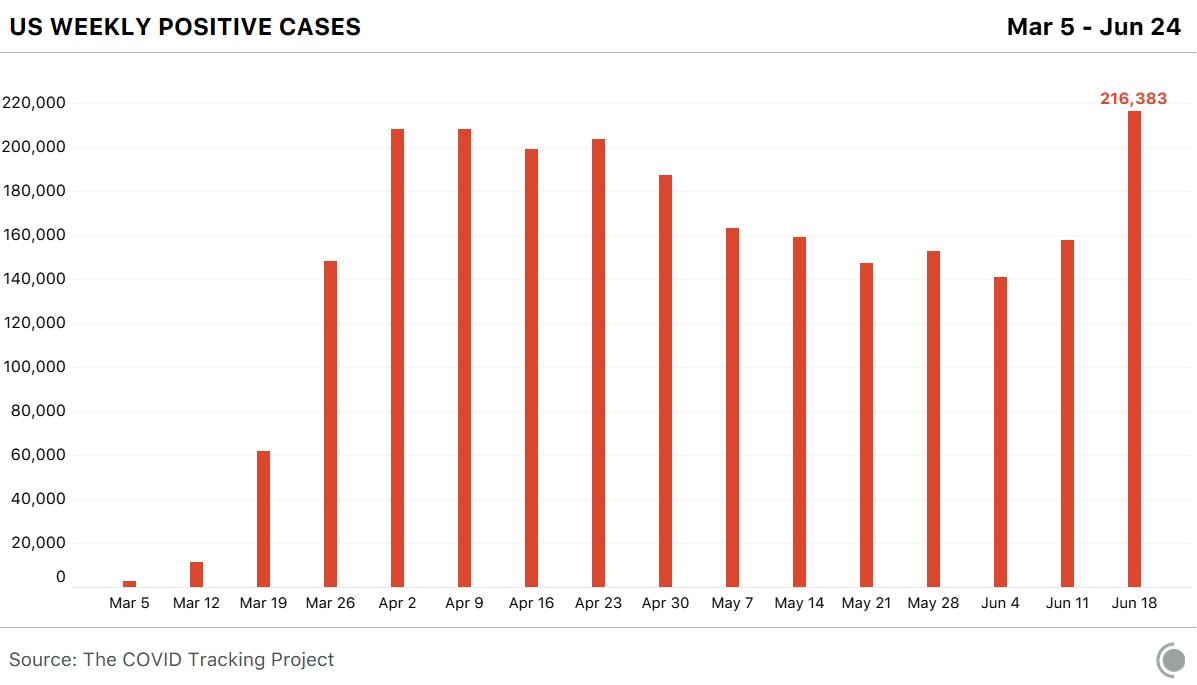
If you want more in-depth analysis of the last week, our team members put together this update.
covidtracking.com/blog/weekly-co…
covidtracking.com/blog/weekly-co…
Other @COVID19Tracking team members put together this in-depth analysis of the current situation for @TheAtlantic:
theatlantic.com/science/archiv…
theatlantic.com/science/archiv…
Finally, while our chartmaking tools are not public yet, @JHUSystems and @JenniferNuzzo have put together some great visualizations with this data:
coronavirus.jhu.edu/testing/tracke…
coronavirus.jhu.edu/testing/tracke…