The COVID Tracking Project Profile picture
We try to provide the most comprehensive state-level coronavirus data. Housed at @TheAtlantic.
Ross Grayson, MPH, CIH Profile picture Aviva Gabriel Profile picture Joshua Galka Profile picture Paul Profile picture Marcos Maurelli Profile picture 38 subscribed
May 20, 2021 4 tweets 1 min read
As we’ve seen with many COVID-19 metrics, there’s often a veneer of uniformity obscuring quiet data discrepancies. In this piece, we look at probable COVID-19 case definitions and the decisions states made about how and when to adopt federal guidance. covidtracking.com/analysis-updat… When states started updating their probable case definitions, as per guidance from the feds, the share of probable cases in their total case counts grew. Our research set out to explore the extent to which this growth was fueled by antigen tests alone.
May 19, 2021 5 tweets 2 min read
During the worst moments of the pandemic, the US public health data infrastructure could not keep up with COVID-19 death counts. Our new analysis looks at the effect of reporting lags on death data reported by states and the CDC: covidtracking.com/analysis-updat… To understand the effect of reporting lags on state COVID-19 death counts, we compared data compiled by the CDC from state dashboards to retrospective data published by some states that charts deaths on the day they actually occurred. Two graphs show 14-day averages and cumulative death counts
Apr 21, 2021 4 tweets 2 min read
State by state, federal COVID-19 testing data is getting better. Over the last few months, we have observed federal efforts to address many of the dataset’s most pressing problems. covidtracking.com/analysis-updat… Throughout the pandemic, the federal government has struggled to count COVID-19 tests. Its dataset has long shown signs of infrastructural problems: covidtracking.com/analysis-updat…
Apr 14, 2021 11 tweets 3 min read
For most of the project, we’ve been laser-focused on gathering data. We recently began a process to understand *how* our data has been used. Here’s what we found. covidtracking.com/analysis-updat… Our largely volunteer-run effort became a definitive and trustworthy source for US COVID-19 data and analysis: for media, scientists and medical professionals, academics, and the government.
Apr 8, 2021 5 tweets 2 min read
With little guidance from the feds, states have had to make their own decisions about compiling and presenting COVID-19 data, leading to sweeping inconsistencies. Here are some of the key reporting problems we found. covidtracking.com/analysis-updat… First up: data definitions. More than one year in, many facets of COVID-19 data are still not standardized. States have defined metrics inconsistently, making summaries and comparisons difficult if not impossible.
Apr 7, 2021 4 tweets 1 min read
Today we’re releasing research on hospitalization data definitions. Hospitalizations are one of the most critical metrics for understanding the state of the pandemic. covidtracking.com/analysis-updat… We found that states differ in how they track patients with confirmed COVID-19, suspected COVID-19, or both. We also observed some states lumping metrics, making comparisons difficult.
Apr 1, 2021 9 tweets 2 min read
Over the past few weeks, we’ve noticed that newsrooms of all sizes—and even some government agencies—have fallen into some of the data potholes that we’ve become familiar with in our year of wrangling public COVID-19 data. So today, we’re offering a brief cheat sheet on avoiding some of the most common errors we’ve seen. covidtracking.com/analysis-updat…
Mar 31, 2021 6 tweets 2 min read
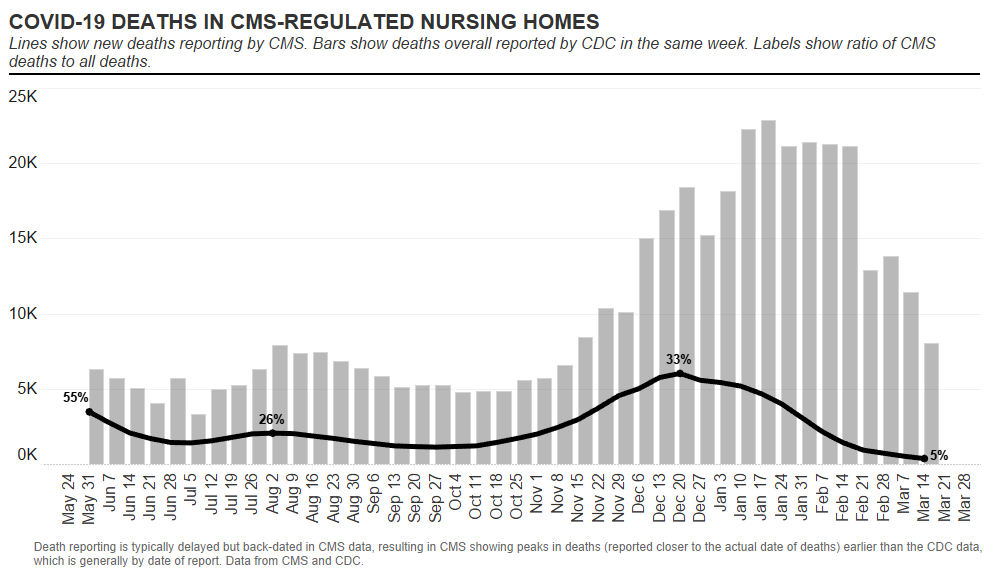
Over the past 10 months, we've tried to determine how COVID-19 affected some of the people most vulnerable to the virus: residents of long-term-care facilities.
covidtracking.com/analysis-updat… Based on official state figures compiled by our team, as of March 4, 2021, at least 174,474 people had died of COVID-19 in long-term-care facilities. This represents 34% of the total deaths due to COVID-19 in the US. covidtracking.com/ltc-topline-es…
Mar 22, 2021 5 tweets 2 min read
While we’ve stopped our data collection, we’ve put together a group of guides to help you navigate and understand federal COVID data.

covidtracking.com/analysis-updat… On Friday we published our latest guide, this one on federal race and ethnicity data. We explain where you can find it, and what you need to know about its limitations.

covidtracking.com/analysis-updat…
Mar 19, 2021 5 tweets 2 min read
Our Federal Data 101 about race and ethnicity data is published.

Publicly available federal race and ethnicity COVID-19 data is currently usable and improving, although it shares many of the problems we’ve found in state-reported data.

covidtracking.com/analysis-updat… Federal race and ethnicity COVID-19 data is not comprehensive enough to represent people’s experience of the pandemic in the United States. Most data is only available nationally, not by state. Two bar charts from the CDC site, one showing cases by race/
Mar 19, 2021 5 tweets 2 min read
For many weeks now, the number of cases and hospitalizations has been going down across the country. Unfortunately, that trend has now reversed in the state of Michigan. Cases * and * hospitalizations are both on the rise there. 4 bar charts with 7-day averages showing cases, currently ho There had been some hopes that if we did see cases rise somewhere, hospitalizations would not follow because many vulnerable people have been vaccinated. But Michigan hospitalizations have increased 45% from their February low.

theatlantic.com/health/archive…
Mar 15, 2021 7 tweets 3 min read
Here's the latest in our ongoing effort to help data users find, understand, and use federal COVID-19 data.

We've created a bit of code that combines federal testing, case, death, and hospitalization data in a single spreadsheet.

covidtracking.com/analysis-updat… One major caveat—we are not committed to maintaining this script should the federal data pages undergo material changes. This is simply a set of instructions for interested data users (and an example of what's possible with federal data).
Mar 11, 2021 5 tweets 2 min read
We’ve concluded our data collection, but fear not: we’ve put together a bunch of resources to help you find COVID data. First, here’s all the data and metadata we collected over the past year. covidtracking.com/about-data/dat…
Mar 8, 2021 14 tweets 7 min read
Our daily update is published. States reported 1.2 million tests, 41k cases, 40,212 hospitalized COVID-19 patients, and 839 deaths. This is our final day of data collection after a very long year. 4 bar charts showing key COVID-19 metrics for the US over ti The project was initially created to track testing. The first few days, states reported just a few thousand total tests. Today, states reported 1.2 million tests. The single-day high for the year was December 5 at 2.3 million. Cumulatively, we've tracked 363 million tests. A bar chart showing cumulative tests reported in the United
Mar 6, 2021 5 tweets 2 min read
In the last of our rolling updates to our totalTestResults API field before we end data collection tomorrow, we switched totalTestResults for MT, NM, and WV from summing positive+negative to drawing data directly from totalTestsViral.
covidtracking.com/about-data/tot… These changes close the book on work we began in August 2020 to improve the data in totalTestResults. When our project began, most states shared positive and negative results only, so we summed those figures to calculate totals for every state.
covidtracking.com/analysis-updat…
Mar 6, 2021 5 tweets 2 min read
Our daily update is published. States reported 1.7M tests, 69k cases, 42,541 currently hospitalized, and 2,221 deaths.

This is our final weekday update. We'll tweet our last daily data this Sunday, though we will periodically post deeper analysis beyond that date. Alt: 4 bar charts showing key COVID-19 metrics in the US. St Currently hospitalized is under 50 per million people in 8 states, up from only 2 states in early February. Alt: Cartogram showing the number of patients currently hosp
Mar 5, 2021 5 tweets 2 min read
The COVID Tracking Project is ending data collection this Sunday. As part of our wind down process, we are for the first time publishing our full data annotations, a set of structured metadata on how states define their COVID-19 metrics.
covidtracking.com/analysis-updat… Health data pipelines in the US are siloed, with each state running its own pipelines to collect data on COVID-19’s spread. In the absence of federal guidelines, and constrained by technical limitations of their systems, many of them use different data definitions.
Mar 5, 2021 4 tweets 2 min read
Since The COVID Tracking Project is winding down on March 7, we’re packaging up what we’ve learned about federal COVID-19 data in a 101 series. Up today: federal testing data. covidtracking.com/analysis-updat… Unlike case, death, and hospitalization data, federal testing data doesn’t match well to the state data we collect. The discrepancies point to problems with both state and federal data sources. Our deep dive on that: covidtracking.com/analysis-updat…
Mar 5, 2021 5 tweets 1 min read
For our API users: Yesterday, we switched totalTestResults to use values from totalTestsViral instead of being calculated from positive+negative in 4 states: IL, ME, MI, and SD. These switches caused the totalTestResults field to increase by ~325k (cumulatively). The increases were driven by MI and SD, because our old totalTestResults counted MI positives and SD positives and negatives in units of unique people instead of specimens.
Mar 5, 2021 5 tweets 2 min read
Our daily update is published. States reported 1.6 million tests, 65k cases, 44,172 currently hospitalized COVID-19 patients, and 1,743 deaths. Four bar charts showing key COVID-19 metrics for the US over Today’s update includes 31k previously unreported tests in MN and 2125 previously unreported cases in TX.
Mar 4, 2021 7 tweets 3 min read
Today we published our final weekly update. COVID-19 cases, deaths, and hospitalizations continue to decline, while tests are up 12 percent. covidtracking.com/analysis-updat… 4 bar charts showing weekly COVID-19 metrics for the US. Cas Although holiday and storm-related reporting disruptions appear to have affected reported cases, tests, and deaths in recent weeks, the data does not currently suggest that case or death declines are reversing. Bar chart from Nov 1, 2020 - Mar 3, 2021 showing the daily p