Thom-Ivar van Dijk Profile picture
Jun 29, 2020 11 tweets 10 min read Read on X
Update 29 June (thread)

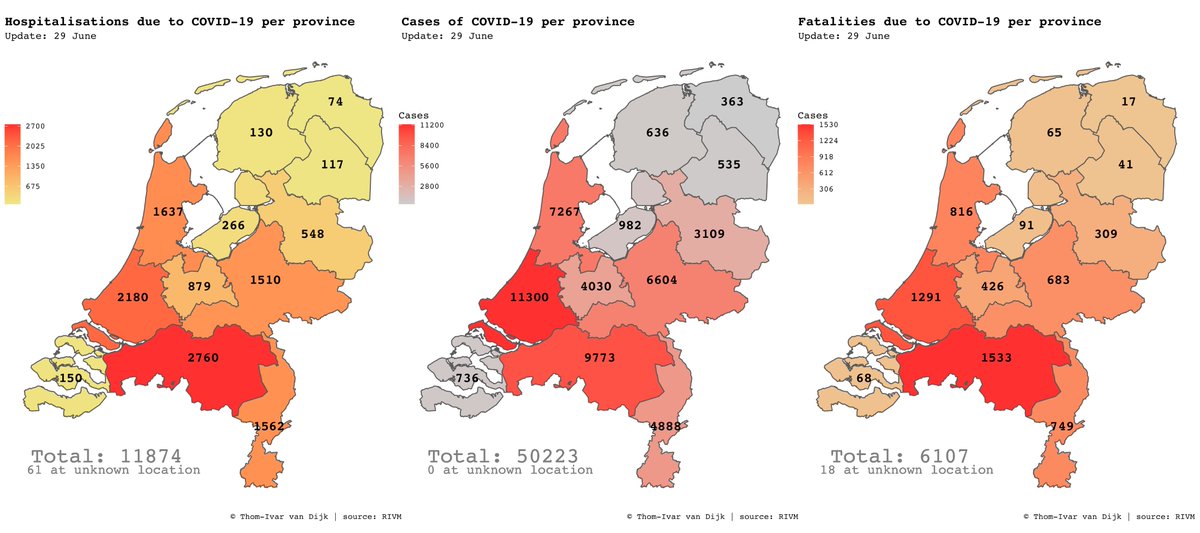
76 new confirmed cases (total: 50.223)
2 new fatalities (total: 6.107)
3 new hospitalisations (total: 11.874)

The map shows cases, hospitalisations and fatalities in nominal, per capita and growth figures.
(RIVM)
#coronakaart #coronavirusNL #COVID19NL Image
The total number of hospitalisations, cases and fatalities due to #COVID19 per Dutch province.

#coronakaart #coronavirusNL #coronavirusNederland Image
3 municipality report one new hospitalisation due to #COVID19, compared to yesterday.

3 new hospitalisation are located and 0 hospitalisations are removed.

#coronakaart #coronavirusNL #CoronaCrisis Image
40 municipalities report at least one new cases of #COVID19, compared to yesterday.

80 new cases are located and 1 case is removed.

The biggest increase is in 's-Gravenhage (+10) and Rotterdam (+8).

#coronakaart #coronavirusNL #CoronaCrisis Image
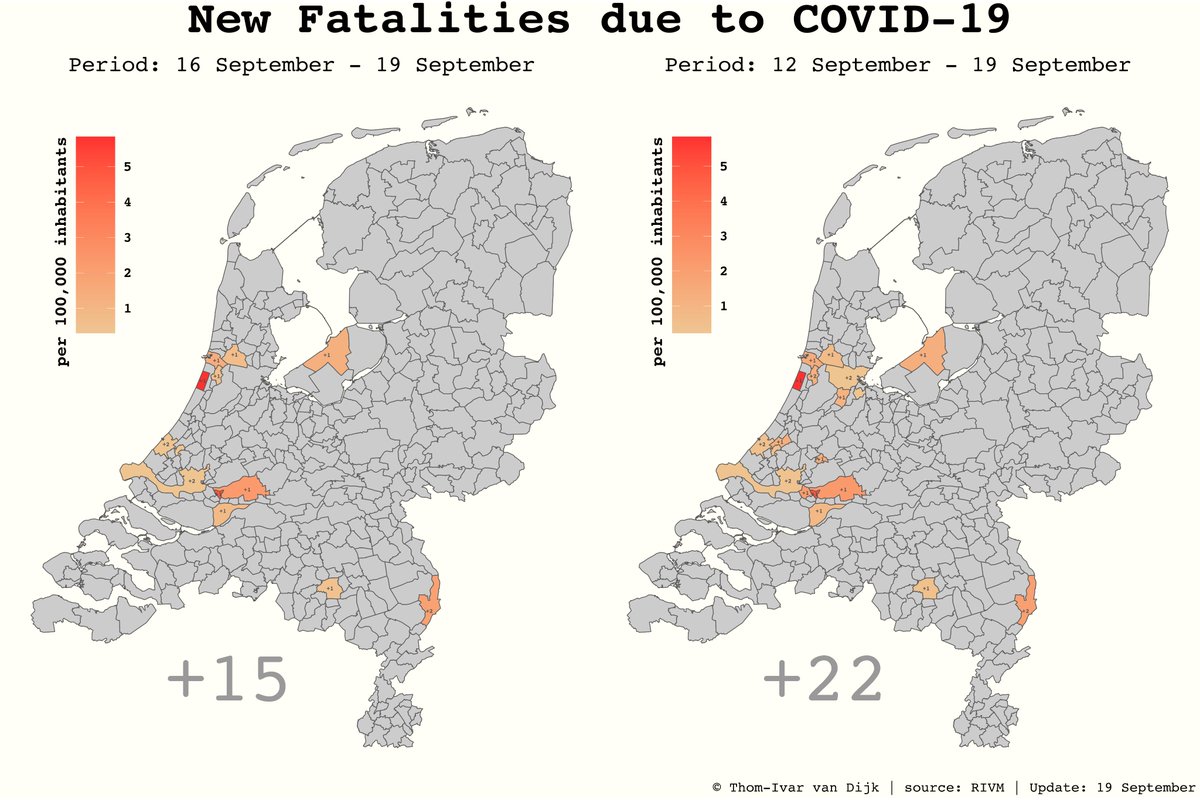
2 municipalities report one new fatality due to #COVID19, compared to yesterday.

2 new fatalities are located and 0 fatalities are removed.

#coronakaart #coronavirusNL #CoronaCrisis Image
Municipalities with most cases, hospitalisations and fatalities, both nominal as well as per 10,000 inhabitants.

#coronavirusNL #COVID19NL Image
Maassluis has the highest growth rate of confirmed cases over the last week, measured as the difference in percentage (+22.73%).

Graphs for other municipalities available on request!
#coronavirusNL #COVID19NL Image
2 new fatalities are reported. There might be some delay in these reports. Growth rates are rounded to the nearest tenth.

The youngest deceased (out of all deceased) is between 15 and 19.

#coronavirusNL #COVID19NL Image
Absolute new cases of #COVID19 per Dutch province:

Drenthe, Flevoland, Friesland, Groningen, Zeeland (+0)
Limburg (+1)
Overijssel (+4)
Gelderland, Noord-Holland, Utrecht (+9)
Noord-Brabant (+10)
Zuid-Holland (+34)

#coronavirusNL
Cases of #COVID19 per Dutch province per 100,000 inhabitants over time:

#coronavirusNL Image
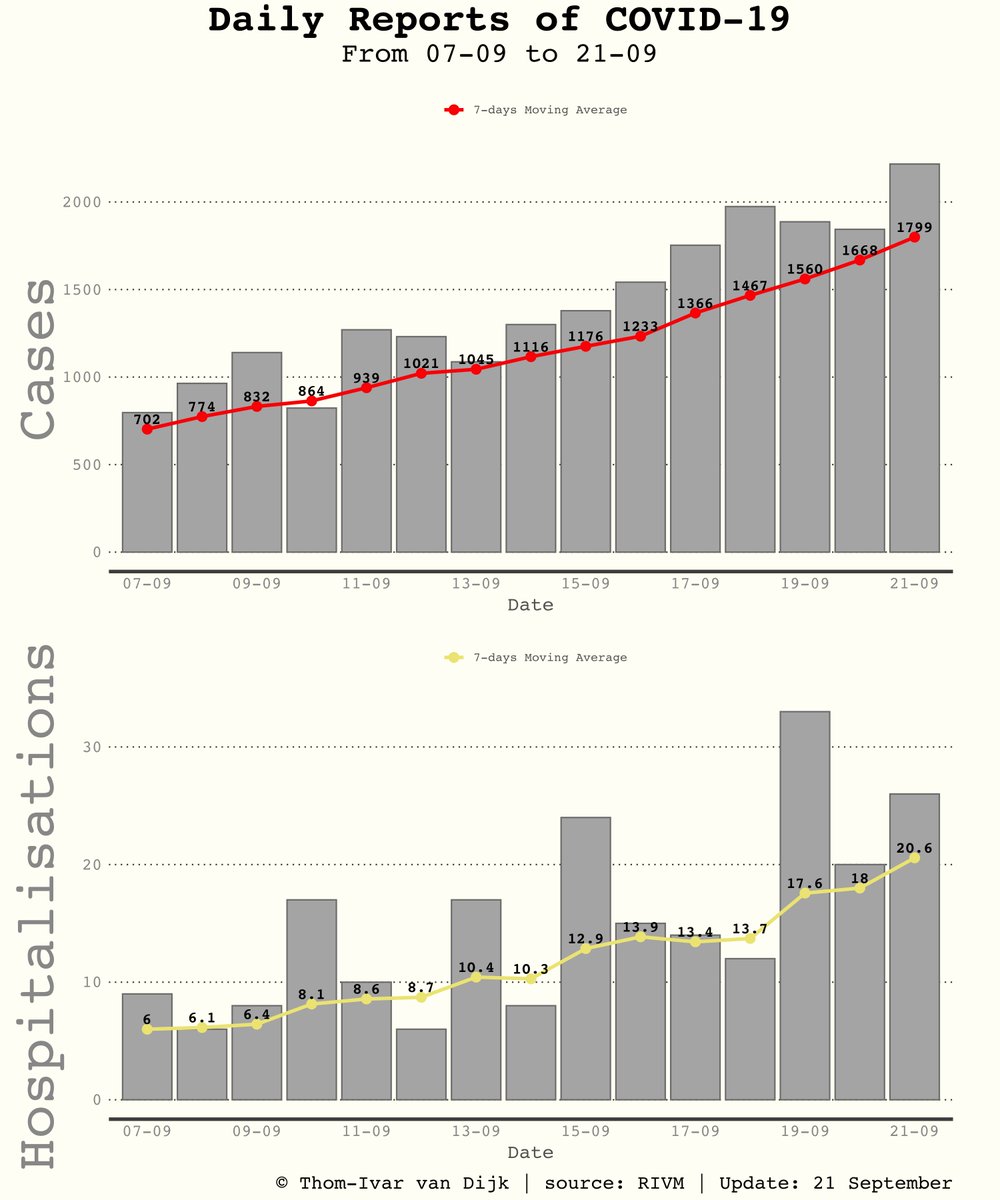
New reported COVID-19 cases per Dutch province over time. The graph shows the absolute number of newly reported cases, as provided in the daily report of the RIVM.

#coronavirusNL #COVID19NL Image

• • •

Missing some Tweet in this thread? You can try to force a refresh
 

Keep Current with Thom-Ivar van Dijk

Thom-Ivar van Dijk Profile picture

Stay in touch and get notified when new unrolls are available from this author!

Read all threads

This Thread may be Removed Anytime!

PDF

Twitter may remove this content at anytime! Save it as PDF for later use!

Try unrolling a thread yourself!

how to unroll video
  1. Follow @ThreadReaderApp to mention us!

  2. From a Twitter thread mention us with a keyword "unroll"
@threadreaderapp unroll

Practice here first or read more on our help page!

More from @ThomIvar

Sep 22, 2020
Update 22 September

2.245 new cases (total: 98.240)
10 new fatalities (total: 6.291)
32 new hospitalisations (total: 12.467)
(differences w.r.t. yesterday)

The maps show the cases, hospitalisations and fatalities for the last 3 & 7 days.

1/9
#coronakaart #COVID19NL
The daily reported number of cases & hospitalisations of COVID-19 in the last two weeks.

New cases are measured as the difference in cumulative figures w.r.t. yesterday.

2/9

#COVID19NL
Absolute new number of reported cases, fatalities and hospitalisations per Dutch province. Cumulative numbers per province are in parentheses.

3/9
#coronakaart #COVID19NL
Read 9 tweets
Sep 21, 2020
Update 21 September

2.217 new cases (total: 95.995)
2 new fatalities (total: 6.281)
26 new hospitalisations (total: 12.435)
(differences w.r.t. yesterday)

The maps show the cases, hospitalisations and fatalities for the last 3 & 7 days.

1/9
#coronakaart #COVID19NL
The daily reported number of cases & hospitalisations of COVID-19 in the last two weeks.

New cases are measured as the difference in cumulative figures w.r.t. yesterday.

2/9

#COVID19NL
Absolute new number of reported cases, fatalities and hospitalisations per Dutch province. Cumulative numbers per province are in parentheses.

3/9
#coronakaart #COVID19NL
Read 9 tweets
Sep 20, 2020
Update 20 September

1.844 new cases (total: 93.778)
4 new fatalities (total: 6.279)
20 new hospitalisations (total: 12.409)
(differences w.r.t. yesterday)

The maps show the cases, hospitalisations and fatalities for the last 3 & 7 days.

1/9
#coronakaart #COVID19NL ImageImageImage
The daily reported number of cases & hospitalisations of COVID-19 in the last two weeks.

New cases are measured as the difference in cumulative figures w.r.t. yesterday.

2/9

#COVID19NL Image
Absolute new number of reported cases, fatalities and hospitalisations per Dutch province. Cumulative numbers per province are in parentheses.

3/9
#coronakaart #COVID19NL Image
Read 9 tweets
Sep 19, 2020
Update 19 September

1.887 new cases (total: 91.934)
2 new fatalities (total: 6.275)
33 new hospitalisations (total: 12.389)
(differences w.r.t. yesterday)

The maps show the cases, hospitalisations and fatalities for the last 3 & 7 days.

1/9
#coronakaart #COVID19NL ImageImageImage
The daily reported number of cases & hospitalisations of COVID-19 in the last two weeks.

New cases are measured as the difference in cumulative figures w.r.t. yesterday.

2/9

#COVID19NL Image
Absolute new number of reported cases, fatalities and hospitalisations per Dutch province. Cumulative numbers per province are in parentheses.

3/9
#coronakaart #COVID19NL Image
Read 9 tweets
Sep 18, 2020
Update 18 September

1.974 new cases (total: 90.047)
7 new fatalities (total: 6.273)
12 new hospitalisations (total: 12.356)
(differences w.r.t. yesterday)

The maps show the cases, hospitalisations and fatalities for the last 3 & 7 days.

1/9
#coronakaart #COVID19NL ImageImageImage
The daily reported number of cases & hospitalisations of COVID-19 in the last two weeks.

New cases are measured as the difference in cumulative figures w.r.t. yesterday.

2/9

#COVID19NL Image
Absolute new number of reported cases, fatalities and hospitalisations per Dutch province. Cumulative numbers per province are in parentheses.

3/9
#coronakaart #COVID19NL Image
Read 9 tweets
Sep 17, 2020
Update 17 September

1.753 new cases (total: 88.073)
6 new fatalities (total: 6.266)
14 new hospitalisations (total: 12.344)
(differences w.r.t. yesterday)

The maps show the cases, hospitalisations and fatalities for the last 3 & 7 days.

1/9
#coronakaart #COVID19NL ImageImageImage
The daily reported number of cases & hospitalisations of COVID-19 in the last two weeks.

New cases are measured as the difference in cumulative figures w.r.t. yesterday.

2/9

#COVID19NL Image
Absolute new number of reported cases, fatalities and hospitalisations per Dutch province. Cumulative numbers per province are in parentheses.

3/9
#coronakaart #COVID19NL Image
Read 9 tweets

Did Thread Reader help you today?

Support us! We are indie developers!


This site is made by just two indie developers on a laptop doing marketing, support and development! Read more about the story.

Become a Premium Member ($3/month or $30/year) and get exclusive features!

Become Premium

Don't want to be a Premium member but still want to support us?

Make a small donation by buying us coffee ($5) or help with server cost ($10)

Donate via Paypal

Or Donate anonymously using crypto!

Ethereum

0xfe58350B80634f60Fa6Dc149a72b4DFbc17D341E copy

Bitcoin

3ATGMxNzCUFzxpMCHL5sWSt4DVtS8UqXpi copy

Thank you for your support!

Follow Us!

:(