Our daily update is now published.
States reported over 44k new cases, the new normal. The 7-day average of new cases per day has doubled since 6/13, and now exceeds 41k.
Current hospitalizations saw their biggest jump since 4/21.
For details, see: covidtracking.com
States reported over 44k new cases, the new normal. The 7-day average of new cases per day has doubled since 6/13, and now exceeds 41k.
Current hospitalizations saw their biggest jump since 4/21.
For details, see: covidtracking.com

Hospitalizations continued to rise in the South and West.
Florida’s hospital data is currently missing in the South region, though that should be changing soon.
Florida’s hospital data is currently missing in the South region, though that should be changing soon.

Arizona, California, Florida, and Texas are still at the center of the current surge of new cases. Hospitalization for AZ, CA, and TX all climbing. We expect Florida's data has a similar shape.

California, Texas, and Florida all reported over 6000 new cases today.

Arizona’s update catches some reporting backlog — a common Tuesday data effect across many states. The 7-day average is often more useful to watch.
What's clear: The state’s surge has swamped local testing capacity. This week, almost a quarter of tests have come back positive.
What's clear: The state’s surge has swamped local testing capacity. This week, almost a quarter of tests have come back positive.

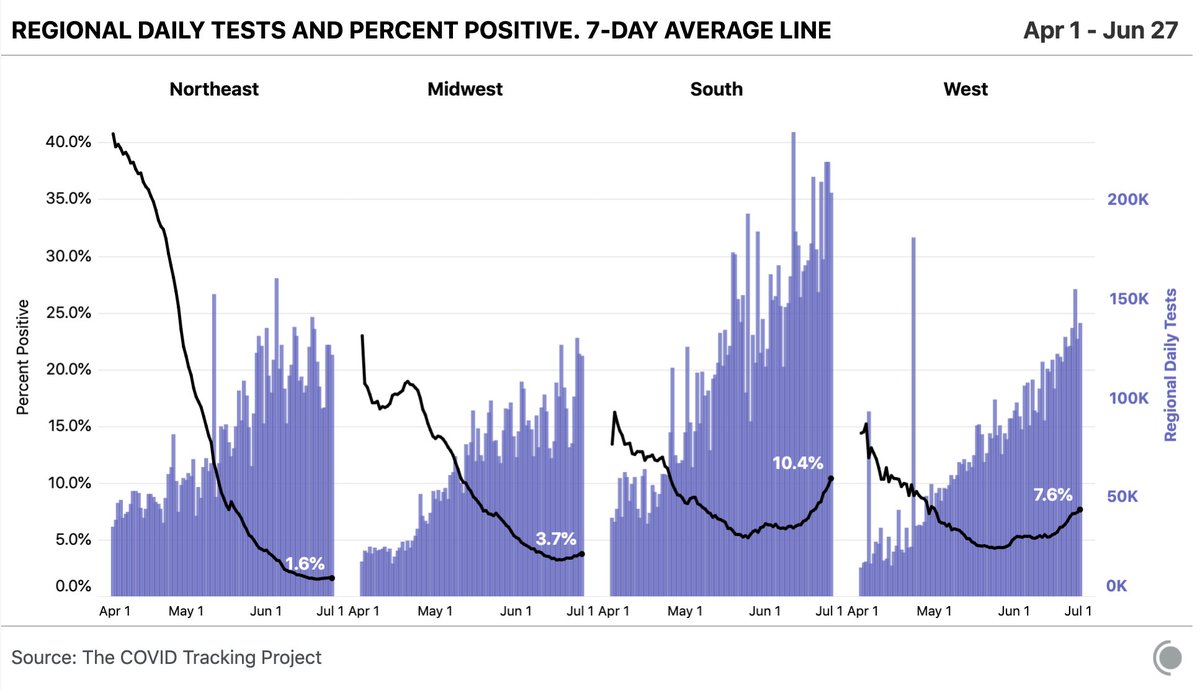
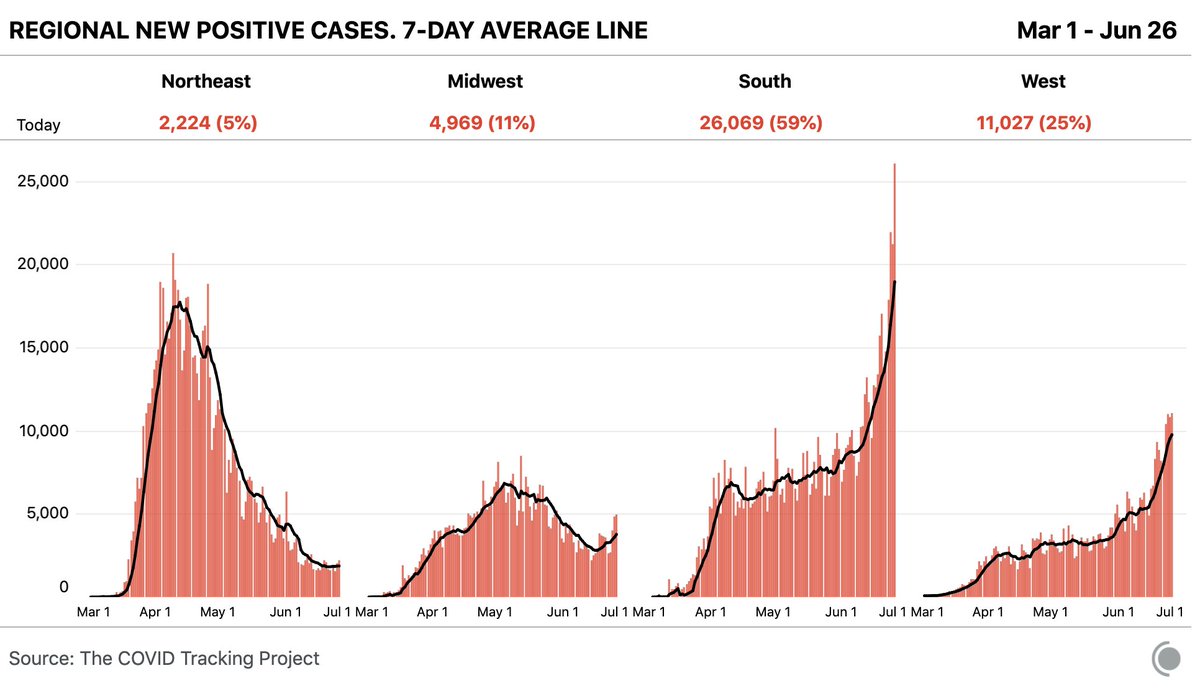
The number of confirmed cases is no longer falling in any region of the country.
The Northeast has been flat for 12 days. The Midwest is rising again.
The Northeast has been flat for 12 days. The Midwest is rising again.

One optimistic point: there are 15 states on the left side of this chart that are finding very few positive cases, even if they're doing a lot of testing. This suggests their mitigation strategies are working.

A second optimistic point: New Mexico looks to be in good shape, despite the huge outbreaks in neighboring states Arizona and Texas.

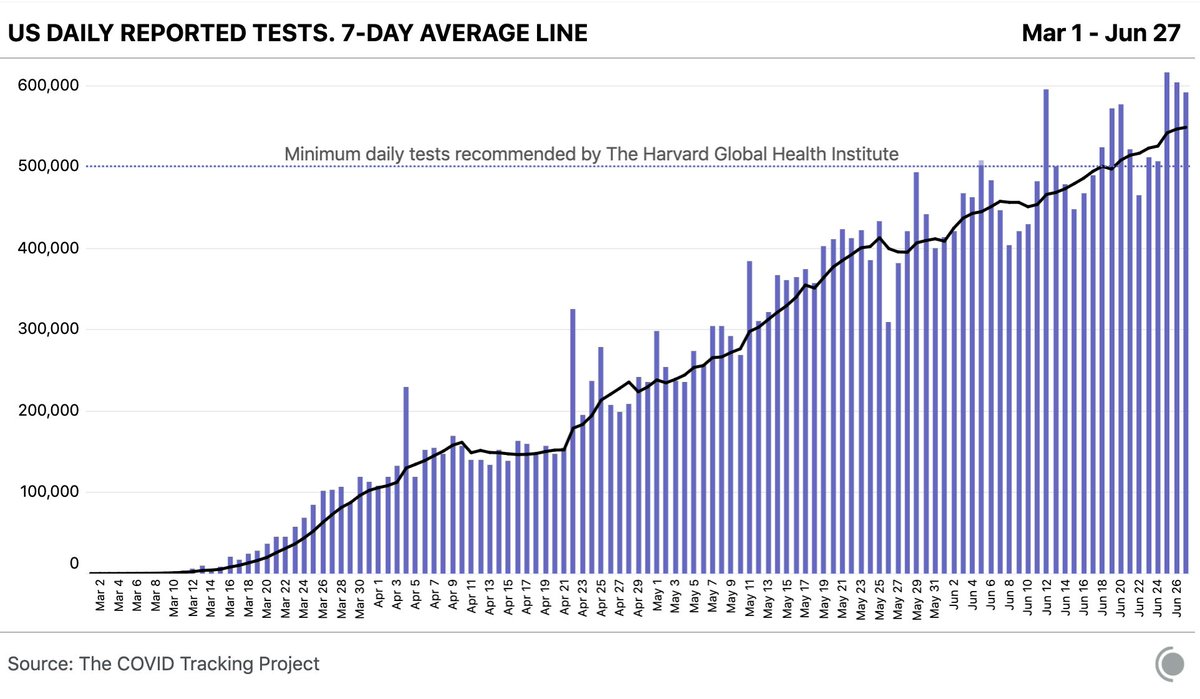
In general, however, the testing situation in the United States appears to be deteriorating as infections grow, report our colleagues at @TheAtlantic:
theatlantic.com/science/archiv…
theatlantic.com/science/archiv…
As we enter this new phase of the pandemic in the US, we're bringing the chartmaking tools we use for these tweets to covidtracking.com, so that you can do more data exploration. They should be up later this week.
We're also redesigning the state data pages. As many of you have requested, they will now have charts. These changes will also go live later this week.

And, in fact, as @kissane notes, they are now live: covidtracking.com/data
California's per capita numbers, for example:
California's per capita numbers, for example: