Kaufman +coauthors have made new collation of proxy data over Holocene (since ~12000BP), a period which IMO is much more interesting than Hockey Stick period (1000 years) since it includes considerable Milankowitch (orbital) variability. IMO CPS results (red) most interesting 
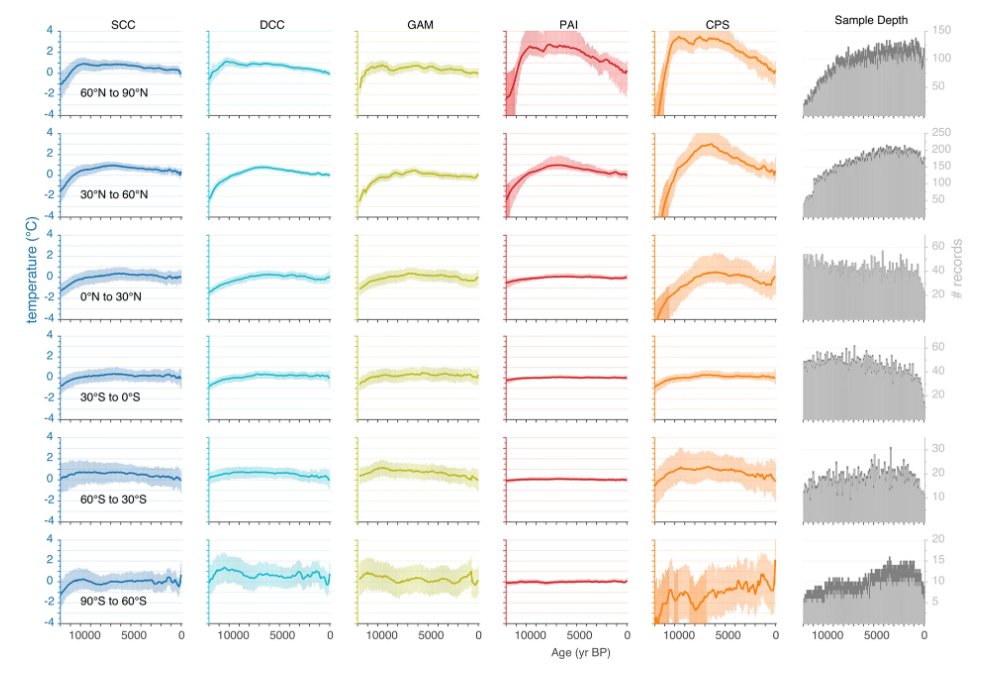
2/ image in article isn't very clear. Here is a re-plot of reconstructions by 6 latitude bands going from N to S. The most northerly (Arctic) band shows elevated temperatures in Holocene Optimum (~10K-7K years ago). Also v sharp recent increase in Antarctic reconstructed temp


3/ looking in close-up, their asserted increase in Antarctic temperature began about 1750 and has amounted to about 2.5 deg C since then. This is inconsistent with other proxy data, even PAGES2K. So how did they get it?

4/ they had 16 proxies from 60S-90S, of which, in addition to ice isotope data, they had two "borehole" series. I don't think that these have any merit. Technically, they require inversion of multicollinear data and IMO introduce all sorts of artifacts. So let's look at Law Dome.

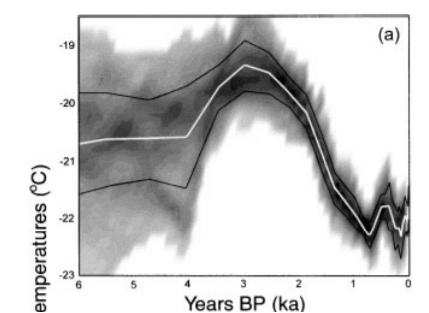
5/ I've looked at this previously. Dahl and Jensen (1999) -pdf here cambridge.org/core/services/… -shows elevated values about 2500BP with recent partial recovery. Original data archived here iceandclimate.nbi.ku.dk/data/ddjtemp.t…
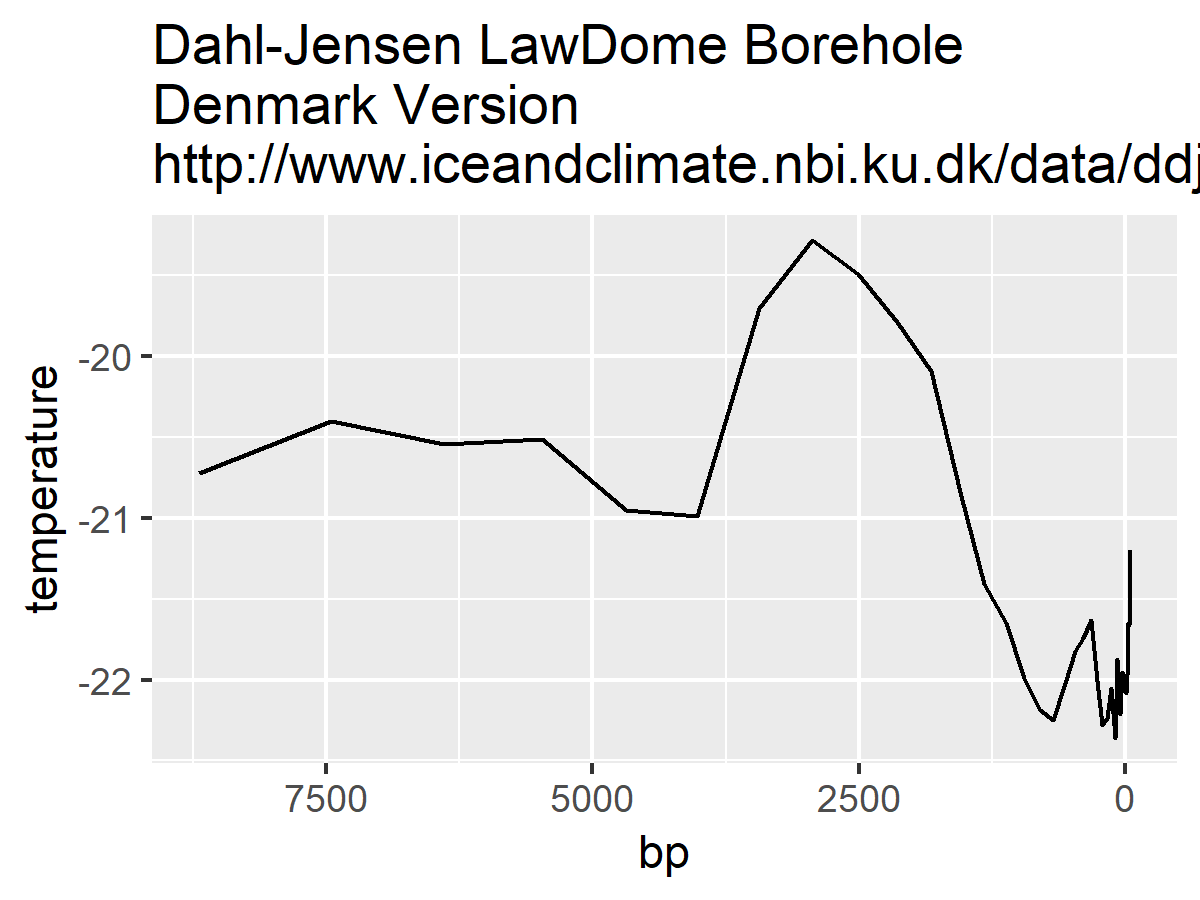
6/ when I plotted up Kaufman's version (from csv file at lipdverse.org/Temp12k/curren…) - at NOAA, they saved data in very user-unfriendly, non-standard and idiosyncratic "LIPD" format (but is the same). This has totally different appearance. What's going on?
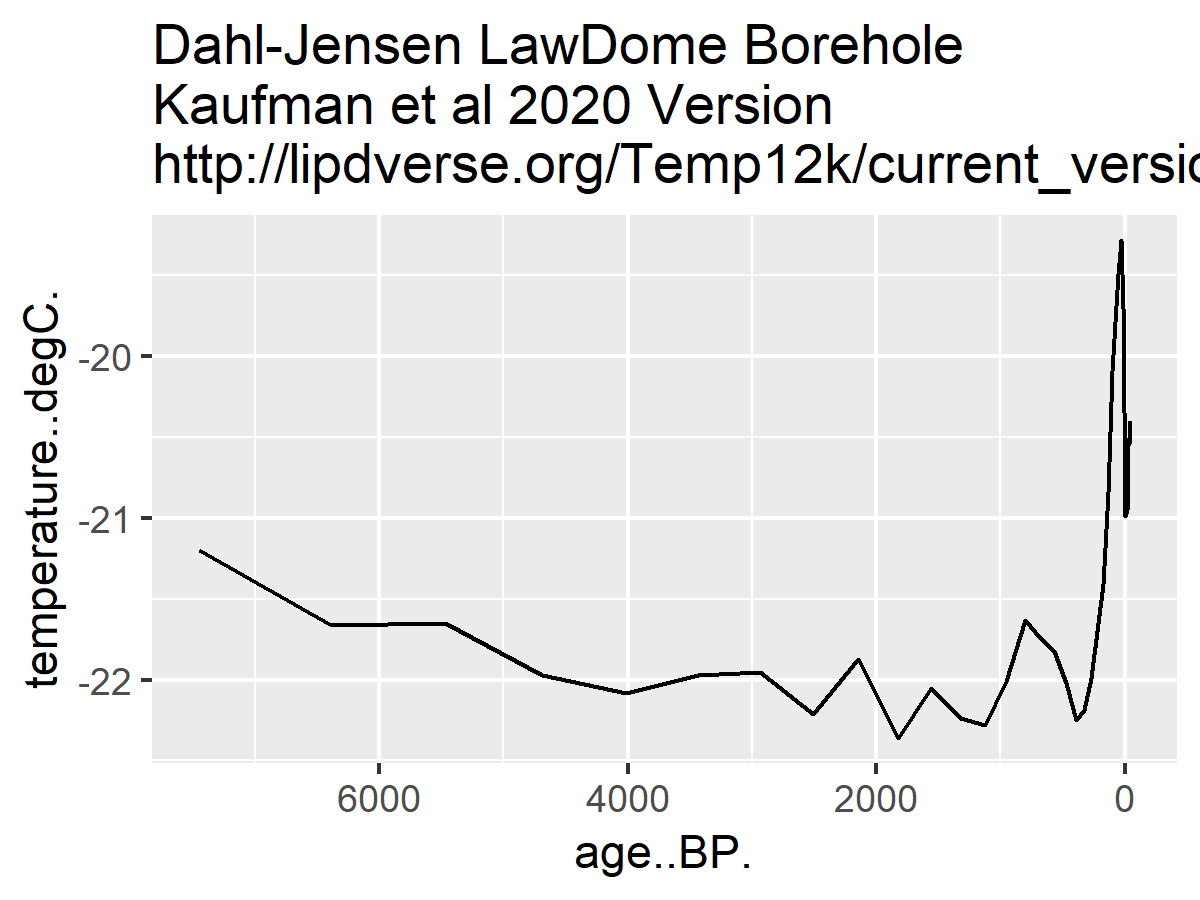
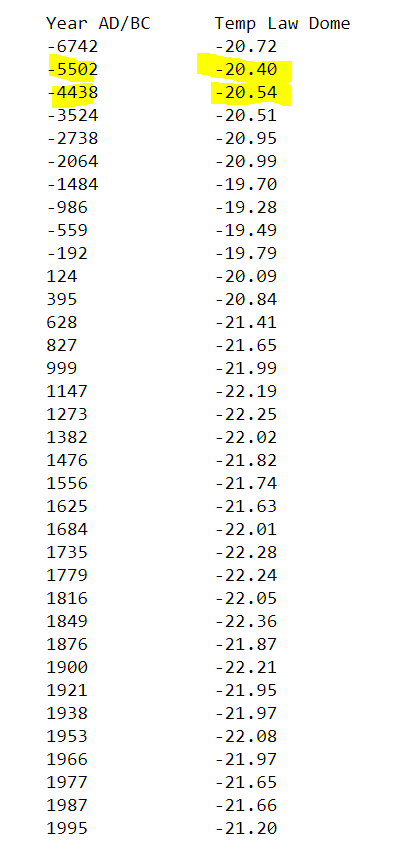
7/ to fully show the difference between published data and data as used by Kaufman, here they are together. Can you figure out what they did from this?

8/ on left is original data; on right is Kaufman version. They've dropped the most recent value from published data and then used the data in reverse order: Dahl's value from 7452BP was assigned to 1995 AD (-45 BP) etc etc


9/ I don't see any valid reason for incorporating a questionable 1999 borehole study into a supposed update. I suspect that it "helped" their conclusion. But, if it is to be used, it should be used in correct chronology, not reverse chronology.
10/ in Kaufman's previous PAGES2K compilation, I noted that, among other errors, they had used Hvitarvatn data upside down - an error which, in itself, had considerable impact on the resulting reconstruction.
climateaudit.org/2013/04/28/gif…
climateaudit.org/2013/04/28/gif…
11/ after a long delay (duing which IPCC used their results anyway), Kaufman et al very grudgingly acknowledged the error.
12/ here's another graph showing the astonishing change between the PAGES2K Antarctic reconstruction (blue), which relied on well-established isotope data, vs Kaufman's new concoction.

13/ there's more to the difference than the botched Law Dome borehole dataset. Suffice it to say that the new Antarctic result, while doubtless pleasing to the mob (of climate academics), is very implausible from non-cherrypicked proxy data.
14/ to elucidate my issue with so-called estimates of temperature history from downhole borehole temperature, here's the pre-inversion data. How do you get a reconstruction with multiple wiggles from such smooth underlying data?

15/ I wrote about this at Climate Audit blog. Curiously, the explanation related to use of principal components, and, in particular, the number of retained principal components - a battleground technical issue in our critique of MBH98.
16/ here's a blog article on "Truncated SVD and Borehole Reconstructions". When one does principal components on smooth (spatially correlated) data, as was done in the borehole inversion, each new component adds another wiggle through Chladni patterns.
climateaudit.org/2009/05/03/tru…
climateaudit.org/2009/05/03/tru…
17/ you can see from the diagram picked up in prior tweet how the inversion (here on a totally different dataset) introduces wiggles (think of dilated Fourier series).
18/ if you do principal components on spatially correlated data located within a square (or any "compact") region, the weights (eigenvector) which are used to calculate each successive principal component are the famous Chladni patterns climateaudit.org/2008/03/28/pc-… .
19/ this Law Dome borehole series also turned up in an interesting Climategate email exchange. See climateaudit.org/2010/04/05/ipc…
20/ for those who might still harbor doubts that a roomful of climate academics in a peer-reviewed Nature article didn't use data backwards, here's a plot of their arrangement of data at their website vs the image shown above from original article.


21/ while images don't appear to be mirror images to untrained eye, they actually are reversed backwards, but scale dilation is different in each version.
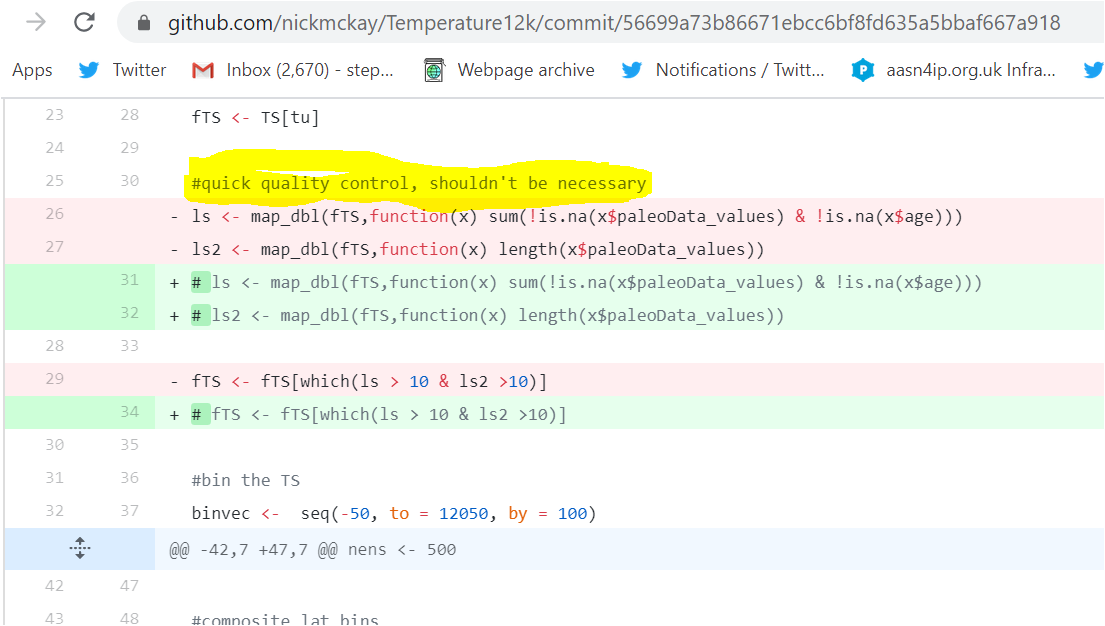
22/ I liked this comment in source code "#quick quality control, shouldn't be necessary". Climate science at its finest. github.com/nickmckay/Temp…