
Week 5 NHS Test & Trace data.
All the more important now we’re not getting daily testing data.
Headline data in picture.
Detail in thread 👇
gov.uk/government/pub…
All the more important now we’re not getting daily testing data.
Headline data in picture.
Detail in thread 👇
gov.uk/government/pub…
As before, definitions
Pillar 1 = testing in PHE labs/NHS hospitals for those with clinical need and in high risk settings like care homes & hospitals.
Pillar 2 = testing for the general public like home kits, drive-through etc.
Pillar 1 = testing in PHE labs/NHS hospitals for those with clinical need and in high risk settings like care homes & hospitals.
Pillar 2 = testing for the general public like home kits, drive-through etc.
Complex cases = outbreaks and cases involving high risk settings like care homes and hospitals. Cases and contacts managed by ‘tier 1’ - local/regional PHE health protection teams, bringing in local authority colleagues where necessary.
Non-complex cases = everything else, cases managed by tier 2 call handlers, contacts managed by tier 3 (this is where most of gov recruitment has been focused)
Note – wk 5 figures will be revised as delayed data come through.
Note – wk 5 figures will be revised as delayed data come through.
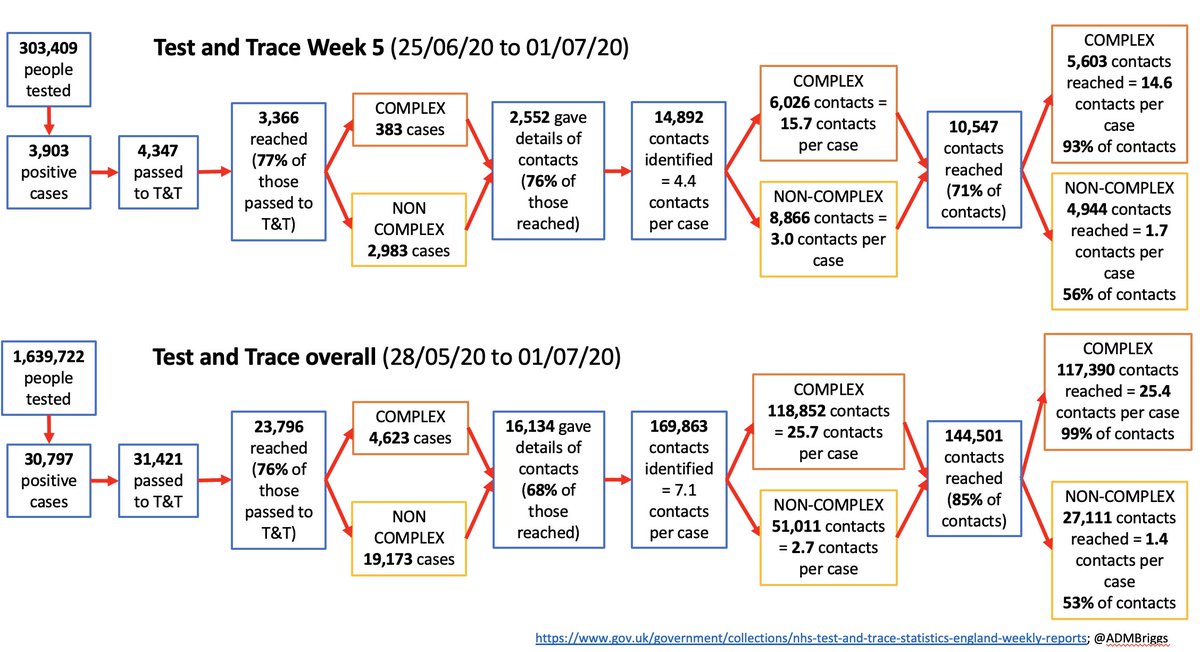
From 25th June-1st July, 3,903 people tested positive.
Downward trend continues: from 5,198 wk 4; 6,237 wk 3; 6,678 in wk 2; 8,781 in wk 1.
Downward trend continues: from 5,198 wk 4; 6,237 wk 3; 6,678 in wk 2; 8,781 in wk 1.
937 pillar 1 (0.8% of tests done); 2,966 were pillar 2 (1.6% of tests done).
Lower than 1.1% and 2.3% last week respectively.
Note, doesn’t mean more COVID in the community; hospitals & care homes are doing mass testing whereas members of public are only testing if symptomatic.
Lower than 1.1% and 2.3% last week respectively.
Note, doesn’t mean more COVID in the community; hospitals & care homes are doing mass testing whereas members of public are only testing if symptomatic.

Note, @ONS COVID survey data covering this period suggest around 1,700 (confidence intervals 700 to 3,700) new community cases a day.
Compares to avg 420 new community cases/day through T&T.
About 1/4 of expected whereas last week was more like 1/6.
ons.gov.uk/peoplepopulati…
Compares to avg 420 new community cases/day through T&T.
About 1/4 of expected whereas last week was more like 1/6.
ons.gov.uk/peoplepopulati…
Test turnaround time in pillar 2 continuing to improve.

Of the 3,903 positive, 4,347 were transferred to T&T.
More than total cases because reportedly includes some cases from wk 4. Plus likely to also include some duplicates put through to the contact tracing system.
More than total cases because reportedly includes some cases from wk 4. Plus likely to also include some duplicates put through to the contact tracing system.
Of those cases transferred to T&T, 3,366 were reached and asked about contacts - that's 77%.
73% in wk 1; 77% in wk2; 74% in wk 3; 78% in wk 4
73% in wk 1; 77% in wk2; 74% in wk 3; 78% in wk 4

Of those reached – 383 were complex
1,682 in wk 1 -> 1,119 in wk 2 -> 846 in wk 3 -> 593 in wk 4
1,682 in wk 1 -> 1,119 in wk 2 -> 846 in wk 3 -> 593 in wk 4
Note these are big revisions upwards from past weeks’ estimates.
See
See
Some will be due to cases escalated from T2 to T1 – initially managed as non-complex, then found to be complex. There are some small downward revisions in non-complex case numbers suggesting this might be happening
Complex cases represent 28% of all cases in wk 1, 25% in wk 2, 16% in wk 3, 12% in wk 4, 11% in wk 5
Number of non-complex cases that are reached has dropped significantly as number of cases in T&T drops but proportion complex remains approx. the same.
4,251 in wk 1 -> 3,444 in wk 2 -> 4,304 in wk 3 -> 4,191 in wk 4 -> 2,983 in wk 5
4,251 in wk 1 -> 3,444 in wk 2 -> 4,304 in wk 3 -> 4,191 in wk 4 -> 2,983 in wk 5
Of those 3,366 cases who were reached, 2,552 (76%) gave details of one or more contact.
This is up from 74% last week, and up from 60% in wk1, 63% in wk2, 71% in wk 3.
This is up from 74% last week, and up from 60% in wk1, 63% in wk2, 71% in wk 3.

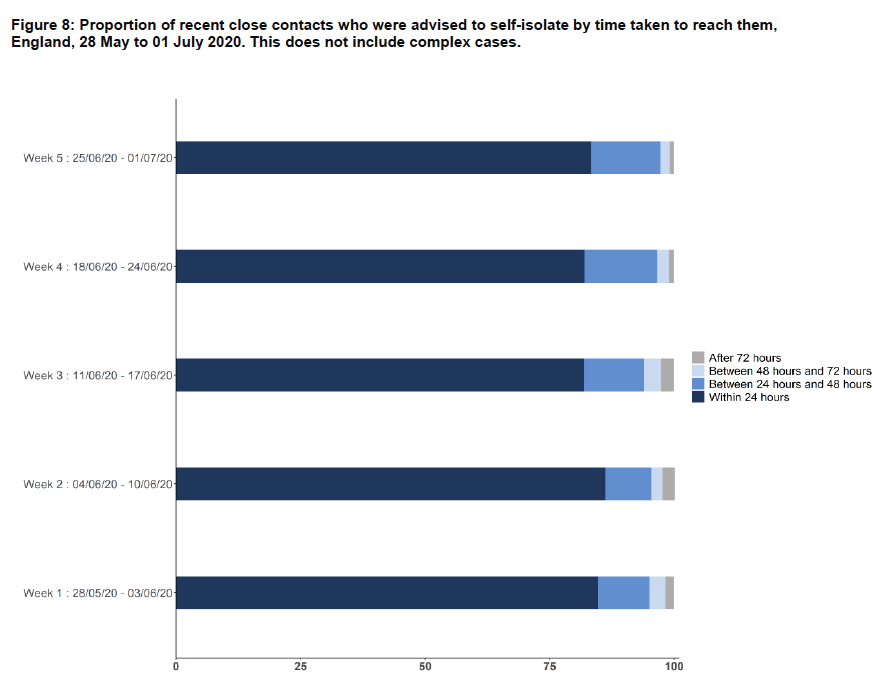
And among those non-complex cases, the percentage of cases reached within 24hrs is 70%, considerably better than 66% the week before.

In terms contacts reached, T&T report that 14,892 contacts were identified, and 10,547 reached.
That’s 71%, down from 91% in the first two weeks, 82% in wk 3, 74% in wk 4. The drop is driven by the fall in complex cases mentioned above.
That’s 71%, down from 91% in the first two weeks, 82% in wk 3, 74% in wk 4. The drop is driven by the fall in complex cases mentioned above.

Overall contacts per case is falling and is now 4.4 (compared with 8.9 in wk 1; 10.1 in wk 2; 6.2 in wk3; 5.1 in wk4).
If complex – 6,026 contacts were identified, of which 93% were reached and asked to isolate.
Big fall in number of identified contacts from 12,187 the week before, and 20,575 in wk3.
Big fall in number of identified contacts from 12,187 the week before, and 20,575 in wk3.

Not sure about the 7% contacts not reached, this may be due to more complex workplace settings, or as simple as when entering complex contacts into the T&T computer system, there is a box to check that you’ve managed all contacts or not.
Therefore, despite you letting all the appropriately people know (home managers etc), you may still click no on the expectation that it hasn't happened yet but will happen soon, but then not go back to the computer system to amend later.
Contacts per complex case is 15.7. This compares to 20.6 in wk 4, 24.3 in wk 3, 33.3 in wk 2, and 25.4 in wk 1.
All revised down significantly due to revised increase in cases that are complex without anywhere near the equivalent rise in contact numbers.
All revised down significantly due to revised increase in cases that are complex without anywhere near the equivalent rise in contact numbers.
Is this because later escalated cases aren’t have contacts identified, or aren’t transferring to the complex cases for data recording?
Or are these different types of cases? I.e. if it’s a care home it’s escalated immediately, but if a workplace setting or later found that a case visited a GP setting that needed escalating, then case may be escalated later and there may be very few contacts.
Falling contacts per complex case may also be due to a shift in the types of complex settings being managed, and better general social distancing/use of PPE in these setting. I think less likely due to data anomaly.
If non-complex – 8,866 contacts were identified, and 4,944 reached. This is 56% of possible contacts (was 52% last week). Of the 56% not reached - half don’t pick up the phone/refuse, half never have contact details in the first place.
56% seems like a decent improvement.
56% seems like a decent improvement.

Total contacts identified per non-complex case continues to creep up, now 3.0 compared with 2.9 in wk 4.
And now the contacts reach per case also rising, now 1.7 (from 1.5 previous week)
Both are good.
And now the contacts reach per case also rising, now 1.7 (from 1.5 previous week)
Both are good.
Finally on the data, the percentage of contacts given advice who were reached within 24hrs has remained relatively high at more than 80%
Overall,
-fewer cases going to T&T wk on wk
-far fewer than ONS estimated number of community cases, but MUCH better than last week
-continuing decline in complex cases
-77% of cases reached, no change on prev week
-76% of these gave details of a contact. Better than wk 4
-fewer cases going to T&T wk on wk
-far fewer than ONS estimated number of community cases, but MUCH better than last week
-continuing decline in complex cases
-77% of cases reached, no change on prev week
-76% of these gave details of a contact. Better than wk 4
-only 71% of contacts reached –worse than wk 4
-again because smaller proportion of complex cases where reaching contacts easier
-drop in percentage of complex contacts reached to 93% may be due to various reasons
-again because smaller proportion of complex cases where reaching contacts easier
-drop in percentage of complex contacts reached to 93% may be due to various reasons
-number of contacts per complex case falling still falling, may be due to changes in types of settings, or PPE/social distancing practice within these setttings
-number of contacts per non-complex case rising v slightly.
-number of contacts per non-complex case rising v slightly.
Not seeing much of opening of economy being reflected in these data yet, but note revisions to data can be fairly big, and a lot changed from 4th July which may start showing in next week’s data.
How exciting.
How exciting.
I also think it may begin to be reasonable to start drawing some data/policy conclusions from next week as we have more data that's likely to be increasingly reliable.
Will see.
Will see.
As ever, please remember it's 2m unless you really can't. Wear a mask. Get a test if you get symptoms. And isolate if you're asked to.
Just yesterday, 85 people in the UK died from COVID-19.
Just yesterday, 85 people in the UK died from COVID-19.


