Adam Briggs Profile picture
Public health consultant @OxfordshireCC & @HealthFdn. Hon Assoc Prof @Warwickmed. Past Harkness. Health/public health policy. Also @Stornowayband. Views own
Paddy Boocock #Degrowth #ToriesOut Profile picture Peter English #FBPE Profile picture Sara 💙 Profile picture 3 subscribed
Jun 28, 2023 16 tweets 6 min read
Out in @Telegraph today (no ££-wall)

Tl,dr: Scotland has shown that minimum unit pricing works but as deaths from alcohol rise, the government remains silent on alcohol policy in England.

telegraph.co.uk/global-health/… Yesterday, the Scottish government published the final Minimum Unit Pricing (MUP) evaluation report.

It showed:
- alcohol deaths ⬇️13%
- hospital admissions ⬇️4%
-⬇️inequalities
- no obv impact on business

publichealthscotland.scot/publications/e…
Jun 17, 2023 11 tweets 4 min read
I know I'm late to this news and shouldn't be in any way surprised, but it is still so utterly infuriating.

Delayed again until 2025 pending a review.

Very short🧵

bbc.co.uk/news/uk-659367… Gov data shows how price promos are more likely to be applied to unhealthy junk food rather than healthier foods.

And rather than saving people ££, they can lead to around 22% *more* purchases than would otherwise happen, with *more* money spent and *more* consumption. Image
Mar 10, 2023 19 tweets 13 min read
In today's @Telegraph, Sally O'Brien & I discuss @HealthFdn / @IpsosUK polling results on public attitudes to gov policy on alcohol, tobacco, & unhealthy food (no £-wall🔓)

🧵Tl,dr: While gov has a preference for individual responsibility, the public still think gov should act. Gains in healthy life-expectancy have stalled, childhood obesity continues to rise, alcohol-related hospital admissions are up, and tobacco still causes over 500,000 admissions a year.

And there are huge inequalities with more deprived areas disproportionately impacted. ImageImageImageImage
Oct 27, 2022 12 tweets 8 min read
This week's @UKHSA COVID and Flu surveillance report came out today.

tl,dr: COVID rates are falling but Flu case rates on the up, as is RSV.

gov.uk/government/sta… First the good news. COVID cases in hospital clearly falling, in all ages, regions (except perhaps still plateauing in Yorkshire and Humber).

There's still a lag on cases in intensive care and on deaths, but they'll drop soon as well.
Oct 26, 2022 22 tweets 11 min read
This is a really helpful and timely piece of work by @davidfinchthf.

Along with last week's @TheIFS report on how government ££ are spent, it's clear that we need to do more to align public health funding with local needs. 🧵

ifs.org.uk/publications/d… Over the last decade, gains in life expectancy in England have stalled.
Sep 13, 2022 13 tweets 6 min read
This type of shortsighted policy review has reared its head again.

Health is an *asset* & the types of obesity policies being looked at here are exactly the ones that are both most effective AND most likely to narrow inequalities. 🧵

theguardian.com/politics/2022/… Rates of obesity and overweight among children took a huge jump during the pandemic - particularly among more deprived communities.

In an average yr 6 class of 30, 12 will have overweight or obesity.

This thread discusses the data in detail 👇
Image
Jul 28, 2022 12 tweets 6 min read
Hugh's excellent thread highlights the sobering reality of NHS and social care workforce shortages, waiting lists, and underfunding, and the stark tax/funding choices facing the new PM.

The third part of the DHSC triangle is public health 🧵

1/ Most public health services are led by PH teams in local gov. Yet from 2015/16 to 21/22, the grant that funds this was cut in real teams by 24% per head.

Getting back to historic funding would need additional 1.4bn/yr.

In 22/23 it rose by just £93m. 2/

lgcplus.com/services/healt…
Dec 16, 2021 18 tweets 10 min read
We already know that today's COVID surveillance report from @UKHSA isn't going to be particularly pretty, but there are some important things to pull out on age, region, inequalities, and vax.
Note, most recent week is 6th - 12th Dec. 🧵

gov.uk/government/sta… Biggest rises now in younger adults.
Nov 16, 2021 25 tweets 10 min read
Today's release from the National Child Measurement Programme shows a huge rise in childhood obesity in England between 2019/20 and 2020/21.

In an average class of 30 year six primary school children, 12 will have overweight or obesity - 40% up from 35% the year before
🧵 For reception kids, it's a similar story.

In average class of 30, around 8 now have overweight or obesity.

That's now 28%, up from 23% the year before.
Nov 6, 2021 9 tweets 4 min read
ICYMI, both REACT-1 and ONS Coronavirus Infection Survey published updates in the last couple of days.

These are important as they give an indication of how much disease there is in England rather than just those who choose to get tested.

Both use data to last week of Oct.🧵 Both suggest around 1.5%-2% of pop had COVID in the last week or so of Oct.

ONS reports week by week and indicates that rise in infections *may* have plateaued.

REACT-1 reports monthly and shows a big increase in cases compared with Sept, but also suggests cases now falling.
Oct 21, 2021 15 tweets 11 min read
This week's @UKHSA COVID surveillance report is out covering week ending 17th Oct, with case rates and positivity climbing fast.

And the inevitable variation by geography, ethnicity, and deprivation - although not what you might expect. 🧵

gov.uk/government/sta… 
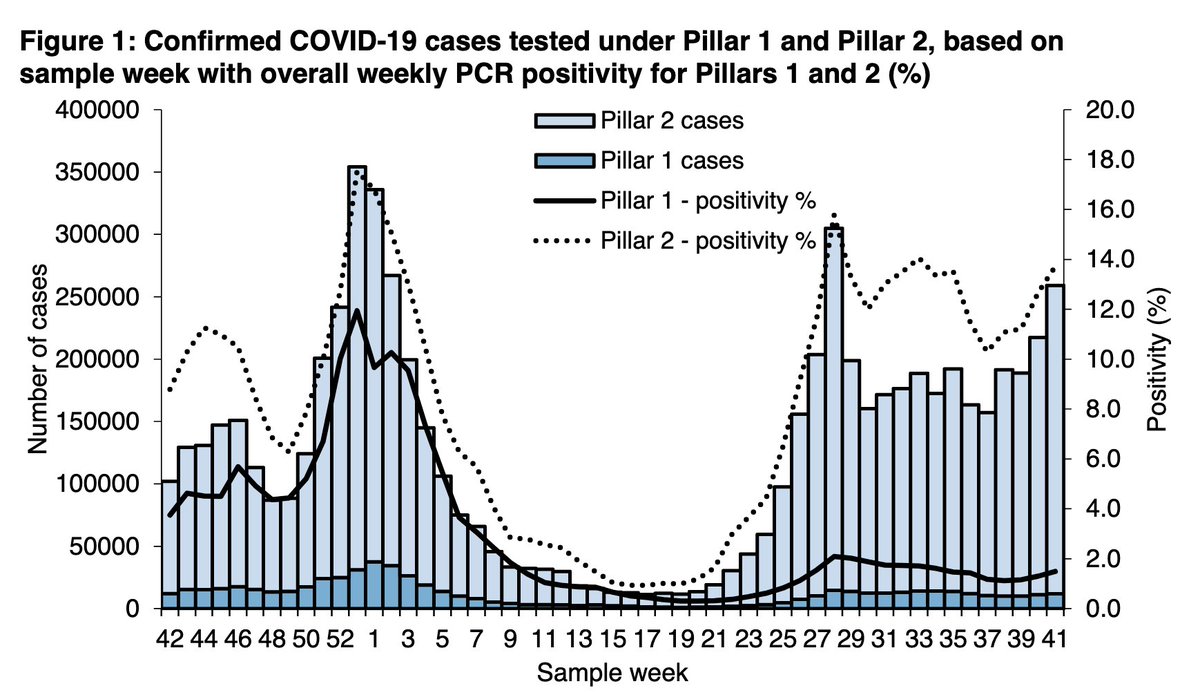
In the most recent week, the number of PCR and LFD tests done has *fallen*, yet weekly case numbers are at 260k - the second highest total since feb. Meaning large rises in positivity.
Jul 15, 2021 23 tweets 12 min read
As case rates rise, here's quick dive into this week's T&T data covering 1st-7th July.

Shows some potentially worrying signals on test turnaround times and in reaching cases. 🧵

gov.uk/government/pub… 
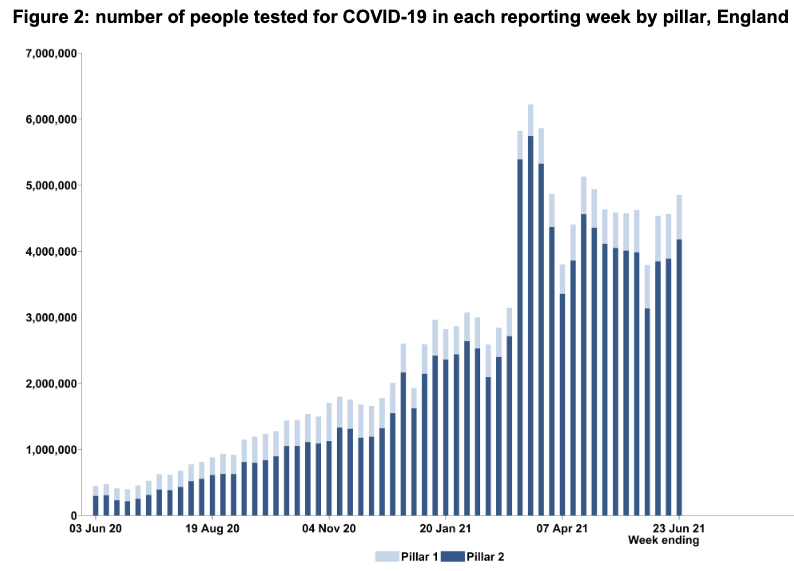
A whopping 5.5m people were tested, up 5% on the week before and due to increases in both LFD and PCR use.
Jul 1, 2021 18 tweets 11 min read
It's been a while since I last wrote about Test and Trace data.

Here's a 🧵about how it's now looking.

Tl,dr: cases and contacts are going up and up, and whilst there *may* be some early signs of the system creaking, it's holding up for now.

Most recent week: 17/6-23/6 Whilst case rates continue to rise week by week, the number of people getting tested is surprisingly changing relatively little.
Jun 10, 2021 15 tweets 11 min read
Latest @PHE_uk surveillance report is here, covering 31st May to 6th June.

- Case rates & positivity (% of tests that are positive)⬆️
- Number of individuals tested ⬇️(partly due to half term).

And case rates now ⬆️⬆️ among 20-29y/os.

🧵for detail

gov.uk/government/sta… Looking by region, the uptick in case rates among 20-29y/o is really marked across multiple regions.

Why?
- combination of social mixing, less vax coverage, more transmissible virus
- much harder to discern from these data about possible role of cases in children moving up ages
Jun 10, 2021 4 tweets 4 min read
And for context, here's our @Telegraph piece on COVID and care homes from April last year.

telegraph.co.uk/global-health/… Plus the three outstanding @HealthFdn reports on social care and COVID-19 over the past year
From July 2020: 'Adult social care and COVID-19: Assessing the policy response in England so far'
@LucindaRAllen @hughalderwick @RichardnotatKF and Phoebe Dunn

health.org.uk/publications/r…
May 27, 2021 15 tweets 12 min read
The weekly @PHE_uk surveillance report has just been published - 17th-23rd May. 🧵

- PCR positivity beginning to creep up
- BIG differences in case rates by age, region, ethnicity, and deprivation

gov.uk/government/sta… While nationally, PCR positivity had been around 0.75% for the previous four weeks, it's crept up this week.

Now 0.87% in the most recent week.
May 13, 2021 17 tweets 12 min read
This week's T&T data - covers 29/4-05/05

🧵tl,dr:
- fewer LFDs
- fewer cases
- fewer contacts reached and it's taking longer, plus what might be the role of international cases
- and why this is the last update to our @HealthFdn performance tracker.

gov.uk/government/pub… 
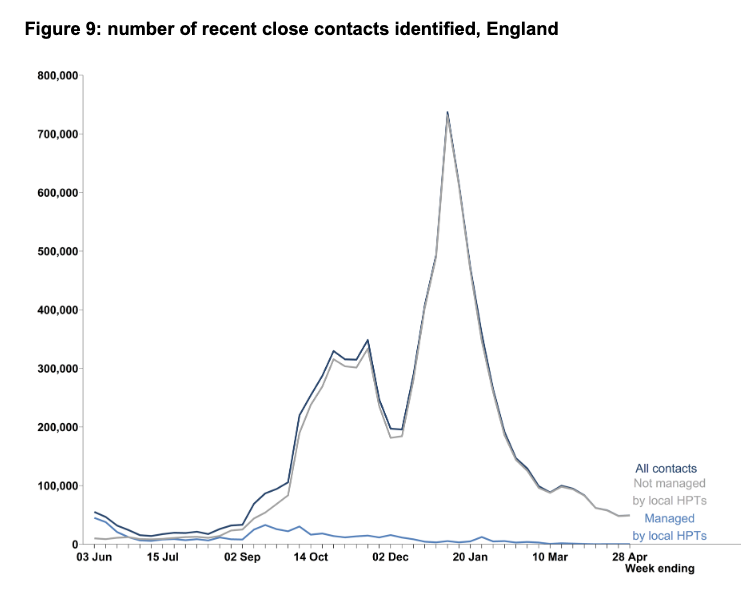
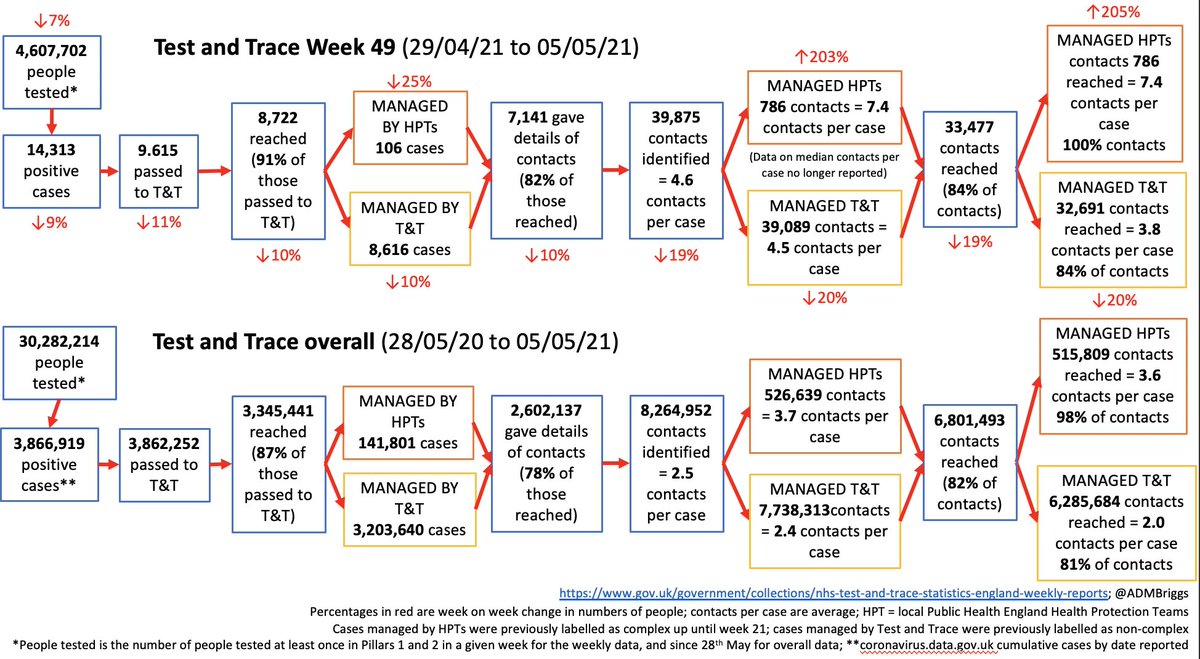
Firstly on the TT data.

Number of people tested is down this week by 7% to 4.61m, with number of positive cases also down 9% to 14,313.
May 13, 2021 8 tweets 7 min read
Short thread on today's PHE Surveillance Report, covers 3rd-9th May.🧵

Shows very similar case rates to previous weeks, but with some clear divergence for 10-19y/os, and for parts of East mids, NW, and Yorkshire/Humber.

gov.uk/government/sta… Furthermore, the significant increases in case rates in some parts of the country continues to raise concerns about potential community spread of variants of concern such as VOC-21APR-02 (first identified in India) among the very places already most impacted by the pandemic.
May 13, 2021 4 tweets 2 min read
Latest REACT study shows that case rates between 15th April and 3rd May (round 11) fell by 50% compared with 11th - 30th March (round 10), from 0.20% to 0.10%

Differences by age, region, ethnicity and deprivation remain (with large uncertainty). short 🧵

imperial.ac.uk/medicine/resea… *Note very wide uncertainty intervals as case rates fall*

In general, highest rates estimated in West Mids and London, and likely falls in all ages except 25-34y/o.

ONS survey tomorrow will update on this.
May 6, 2021 15 tweets 10 min read
Latest T&T data: wk 22-28 April

- no big shifts in numbers tested by LFDs/PCR, and ongoing fall in +ve cases

- but some interesting changes in contact tracing: fewer contacts reached and it's taking longer, and the reasons aren't straightforward🧵

gov.uk/government/pub… While the number of cases transferred to contact tracing fell by 12% to 10,793, the number of close contacts identified rose by 2% to 49,151.

For the first time since the start of August, avg contacts per case was >5.
May 6, 2021 14 tweets 10 min read
This week's PHE surveillance report, 26th April - 2nd May

- despite easing of social restrictions & schools returning after Easter hols, case numbers still going down among all ages.
- still regional/local variation
- and ++concerns around variants.🧵
gov.uk/government/sta… 
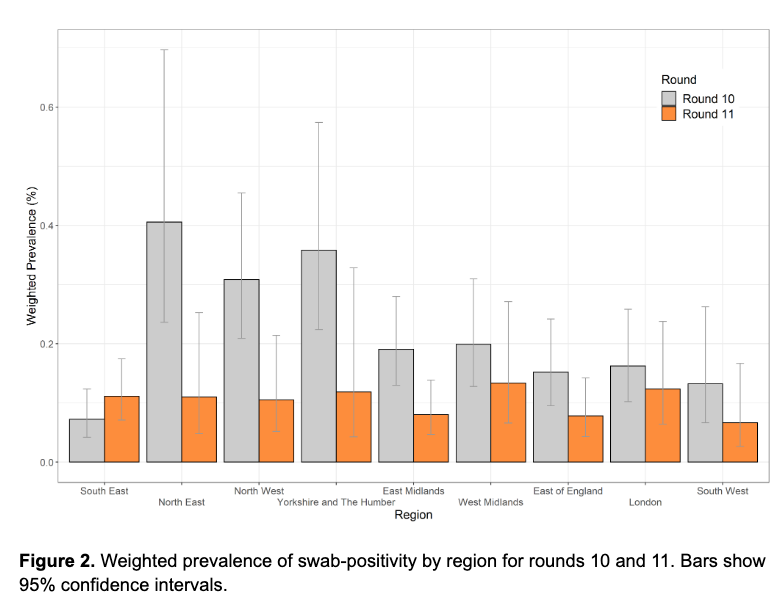
Still some big differences by region - particularly looking at younger adults in Yorkshire and Humber.

Case rates in Y&H are 42/100,000, more than 3 times the rates in the SW at just 12/100,000.