
A huge increase in fatalities from yesterday and last Friday, and its very disappointing. 149 people reported killed by Covid-19 (all preventable deaths if we had locked down earlier and harder) in the UK today. Here's the overall graph (1) 

Its worth having a closer look at the recent trend. We seemed to be on a sharp downturn yesterday, and from a position if still hoping to find a new-normal that was a more rapid decline, that was good. But that has been completely, totally reversed today (2)

Based on the 7 day, 14 day and overall trends, as well as the trend from Friday to Friday, the total should have been a little over 50. Instead the total is three times higher - implying perhaps an overspill of reporting from yesterdays low number? (3)
In the same way yesterdays low number seemed like a hopeful outlier, todays might immediately seem like its a big, nasty surprise. But lets look to see what this does to the overall trends. It puts us back on the same very low rate of decline on the seven day running total (4)

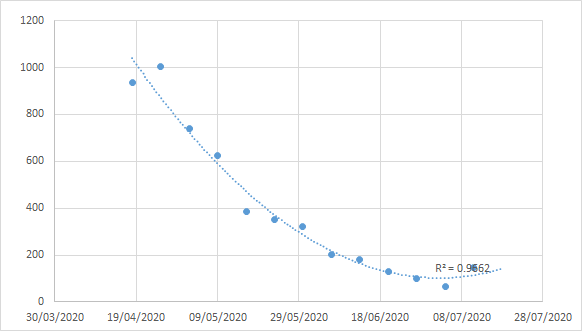
As ever, drop a log on a curve to see if you can flatten it. And straight line is a constant rate. Todays total is back onto the incredibly slow new rate of decline we've been seeing since the second tick. (5)

And if we divide each rays 7 day total by the last we are still perilously close to going up rather than down (6)

This is a big rise for a Saturday, more than twice last weeks total of 67. Saturdays look like this (7)
Whats more worrying is this shows that the trend for R to be on the rise 23 days back (average day for people to catch it) continued, with (as I warned was possible while hoping it wasn't) yesterday now looking like a big outlier (8)

If this calculation is correct its fairly obvious that R was again above 0.9, on another upturn (9)

If we just lok at the crude 23 day average (running total today divided by 23 days ago, the day that people today on average caught it, an average of 7 days) we are going the wrong way. Above 1 here is a danger sign. (10)

And to be absolutely clear - this red line is the rolling 7 day average of fatalities, and it MUST stay below 1 or we're going UP. Are you feeling comfortable with this? (11)

Don't let one days data change everything - but with the exclusion of yesterday we are aren't in a great place. We are back on the knife edge, if indeed we ever left it. If you can look at these numbers and take confidence that we're on a good downslope, please tell me HOW? (fin)
Addendum - tweet (11) itn't clear, sorry. Data points there are each days seven day total divided by the one before, red line is seven day rolling average of that. It has to keep below 1 or deaths are going up.

