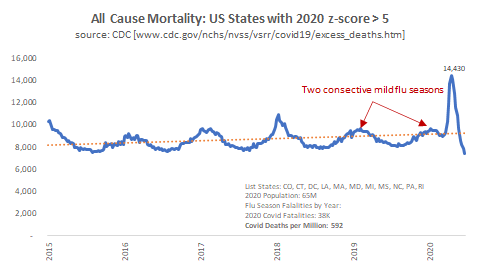
There are 12 US states, plus DC, which have an all-cause mortality z-score in excess of the threshold value of 5 thus far in 2020. Those states exhibit the common pattern of two mild flu seasons followed by a covid spike: 
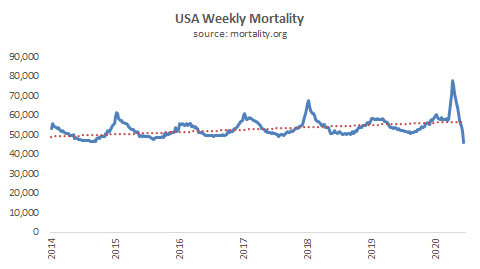
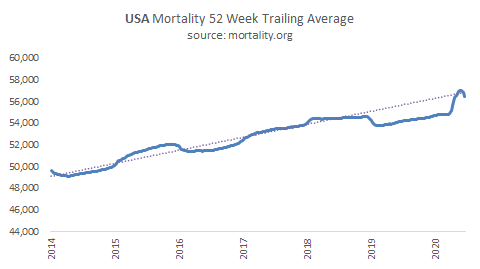
Looking at the 52 week moving average conforms to the expected pattern of "missing" deaths followed by a covid catch-up:
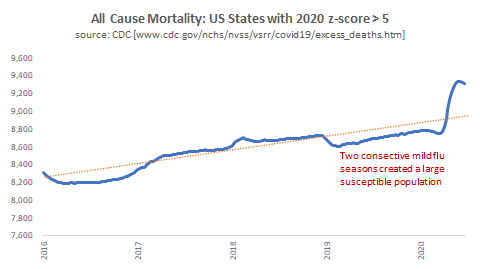
Collectively, these states have reported 592 deaths per million, which is above the burn out threshold predicted by @MLevitt_NP2013 and they have now seen all-cause mortality falling below normal levels.
The majority of US states, with 2/3 of the US populace, have had excess mortality this year but not enough to pass the 5 z-score threshold:
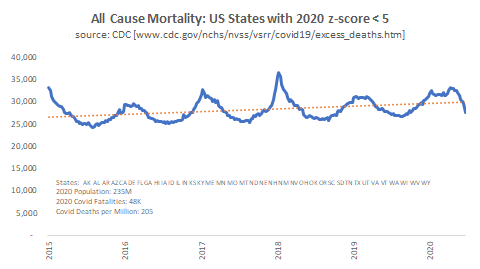
These states have also had two consecutive mild flu seasons with a covid return to normal - but have not seen nearly the same spike as the significantly impacted states:
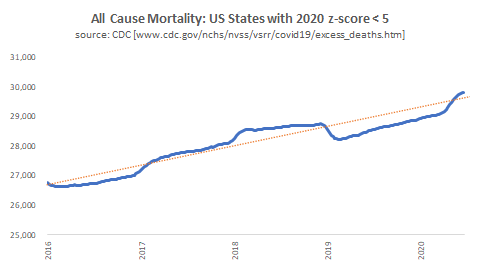
Side-by-side, the patterns are nearly identical - until we examine the relatively size of the covid spike. What did those impacted states do wrong? Many of them seeded nursing homes with covid-positive patients, so that must be part of the story.

It remains to be seen if the some of the states in the mild outbreak group will join the bad outbreak group, but it is unlikely that any will see the same high level of mortality. Certainly none will look anything like New York and New Jersey:
NY/NJ peak mortality week was more than 3X the worst week during the bad 2018 flu season. The "bad" states on the whole saw deaths just 30% elevated.
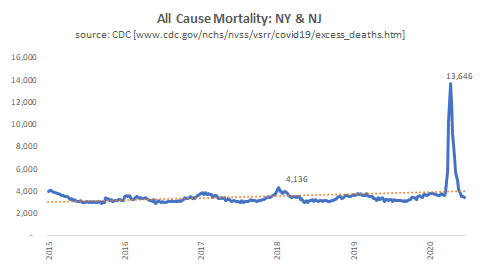
The 52 week moving average shows the disaster than occurred in the NYC metro area for 8 weeks this Spring:
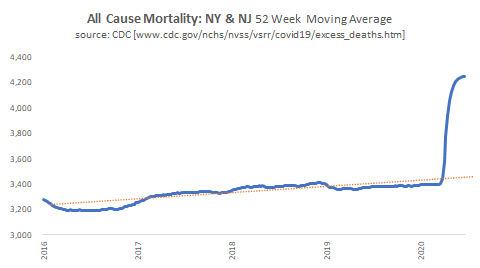
NY and NJ have had more than 1400 covid deaths per million. Dramatically more than the predicted threshold of 500. The graphs speak for themselves - something very different happened in New York City than in other parts of America.
So, what made NY/NJ so vastly different? Vitamin D levels? Population density? Nursing home policy? Comorbidities? All of those were evident elsewhere, but nowhere else showed close to the same impact.
I believe the excess mortality seen in New York was due to mass panic. Too many people being hospitalized for covid, too many people confined indoors together, too much press coverage, too many people avoiding hospitals for heart attack and stroke:
washingtonpost.com/graphics/2020/…
washingtonpost.com/graphics/2020/…
There does not seem to be any medical or demographic reason I can find that explains the disaster in New York but relatively mild impact in Chicago or Detroit and nearly zero impact in Seattle. The gulf between these results is just too vast.
But, the same gulf is evident everywhere we see outbreaks - one or two cities with massively higher impact that other similar regions. There must be some tipping point level of infection which leads to stressed hospitals and a stressed population.