
Sometime back, I had written an article explaining Logarithm, and why do we need it. This time, I have something even more basic
What is 𝐒𝐭𝐚𝐧𝐝𝐚𝐫𝐝 𝐝𝐞𝐯𝐢𝐚𝐭𝐢𝐨𝐧? What's the intuition behind it? Does it have any real world application?
It's going to be a long 🧵!
What is 𝐒𝐭𝐚𝐧𝐝𝐚𝐫𝐝 𝐝𝐞𝐯𝐢𝐚𝐭𝐢𝐨𝐧? What's the intuition behind it? Does it have any real world application?
It's going to be a long 🧵!
***Developing intuition for Standard deviation***
I give you 3 numbers — 3,5,7 and ask for their average/mean
“Duh.. 5” you say, while thinking “maybe this thread wasn’t such a good idea…”. On that, let me pull up another question and the standard of this thread
I give you 3 numbers — 3,5,7 and ask for their average/mean
“Duh.. 5” you say, while thinking “maybe this thread wasn’t such a good idea…”. On that, let me pull up another question and the standard of this thread
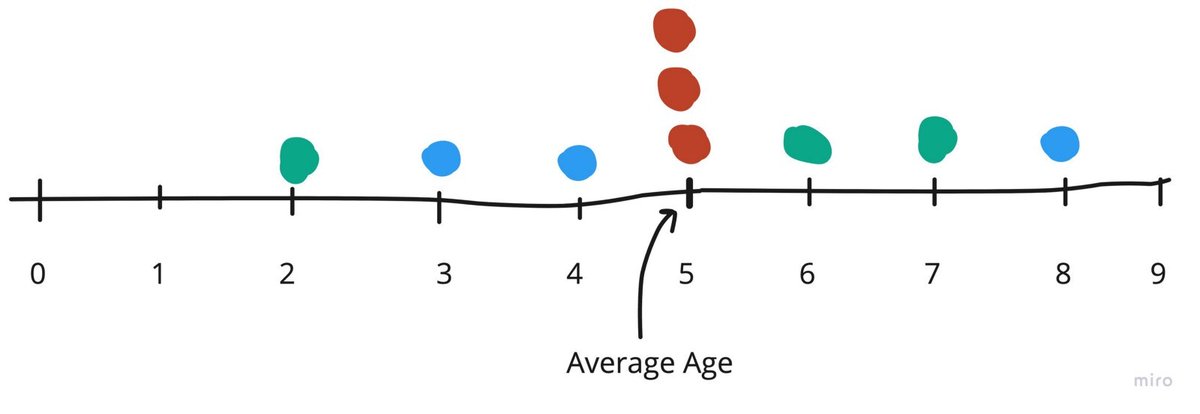
The mean age of 3 children is 5 years. Can you tell me their individual ages?
Can you?
Can you?
You can’t. NO one can, at-least not with the current information
However, you can guess- (3y,4y,8y), (2y,6y,7y) or (5y,5y,5y) being few of them
Given what you know, they are all valid guesses to the question, and respectable ages for children!
However, you can guess- (3y,4y,8y), (2y,6y,7y) or (5y,5y,5y) being few of them
Given what you know, they are all valid guesses to the question, and respectable ages for children!
Note the drift in my question- Instead of asking “Here are my observations, calculate their mean”, I asked “Here’s a summary of my observations, what can you tell me about the observations themselves”
So we agree- A summary that only talks about mean is not enough to say much about the nature of individual observations
***The next time you hear people summarise huge sets of observations with just averages, remember that’s just the opening act of the story.***
***The next time you hear people summarise huge sets of observations with just averages, remember that’s just the opening act of the story.***
If you want to see the entire story unfold, you need more than just mean
That gets us to the next question- What can make our summary more representative of the underlying observations?
To answer that, we find ourselves on the ever friendly number line. Why?
That gets us to the next question- What can make our summary more representative of the underlying observations?
To answer that, we find ourselves on the ever friendly number line. Why?
Because “looking” at the individual observations together might give us clues on how to summarise them better
Do you see any thing unique to each set of observation — grouped by the same color? Something related to the shape of how they are positioned?
Do you see any thing unique to each set of observation — grouped by the same color? Something related to the shape of how they are positioned?
Maybe this will help
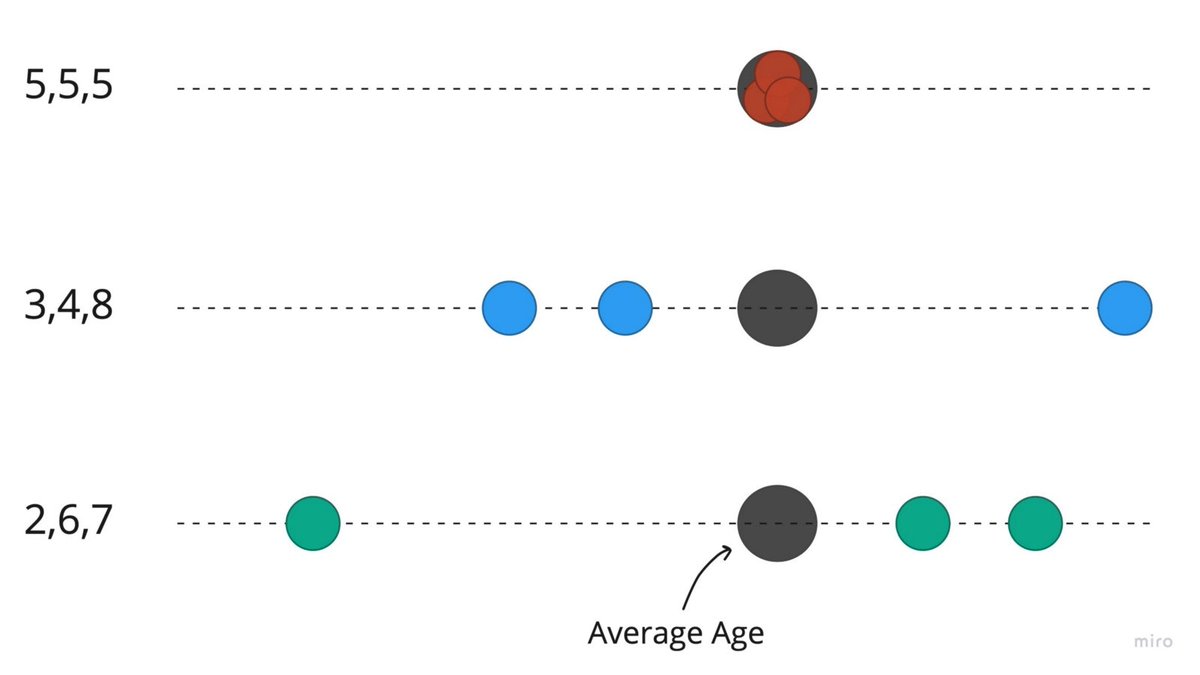
As you can see, for each set of observations, the individual ages are spread differently around the mean. Eg, for the 3 children aged (5,5,5)- there’s zero spread around the mean
I know what you are thinking
“Can we not use “how far is each observation from its mean” as some kind of measure to make our summary better- After all, there seems to be different spread for each set, even though they have the same mean”
Right on!
“Can we not use “how far is each observation from its mean” as some kind of measure to make our summary better- After all, there seems to be different spread for each set, even though they have the same mean”
Right on!
Let’s formalise this measure as Average deviation from mean
Eg, for the set of ages (2,6,7)- the average deviation from mean would be
[(2–5)+(6–5)+(7–5)]/3= (-3+1+2)/3 = 0. Huh?!
Eg, for the set of ages (2,6,7)- the average deviation from mean would be
[(2–5)+(6–5)+(7–5)]/3= (-3+1+2)/3 = 0. Huh?!
If you calculate this measure for any set of observations, you will realise it is zero for all of them(and as it should be! Think why*)
*Explanation in next tweet
*Explanation in next tweet
*What are averages? They represent the typical characteristic/behaviour of some group.
Eg- When you say the average age of a class is 5 years, what you are saying is that there are some students who are less than, some more than, and some exactly 5 years of age
Eg- When you say the average age of a class is 5 years, what you are saying is that there are some students who are less than, some more than, and some exactly 5 years of age
The total deviation(from the typical age) due to students less than 5 years of age has to cancel out the total deviation due to students more than 5 years of age; otherwise the typical age can no longer be 5. Convince yourself that this makes sense
Ok, so Average deviation from mean is out. What if we just squared* the deviation from mean and added them? That could work because then everything is positive and nothing cancels out
Let’s call it the Average squared deviation from mean.
Let’s call it the Average squared deviation from mean.
The smart people have another word for Average squared deviation from mean — Variance
*Some of the keen readers might be thinking, squaring seems arbitrary, why not take the absolute values of the deviations, i.e. treat (-3) as (+3) and add all of them? That could work too, right?
It would; however, a lot of these conventions were chosen for reasons which are beyond the scope of this article
The way I rationalise it to myself is that squaring the deviation from the mean amplifies the spread for farther lying observations- in other words, observations that are farther away from mean should get a louder voice🗣
Let’s go back to the set of ages (2,6,7)- the Variance would be
[(2–5)²+(6–5)²+(7–5)²]/3 = (9+1+4)/3 = around 4.3….but 4.3 what? What is the unit of Variance? Years? But remember we squared the terms above — So it’s 4.3 years²
[(2–5)²+(6–5)²+(7–5)²]/3 = (9+1+4)/3 = around 4.3….but 4.3 what? What is the unit of Variance? Years? But remember we squared the terms above — So it’s 4.3 years²
But years² doesn’t make any sense when we talk about age, right? With a simple stroke of genius, we take the square root of Variance to match the unit of our observation
And now let me introduce you to Standard deviation- The central character of this story and the square root of Variance
***√Variance = Standard deviation***
***√Variance = Standard deviation***
Somehow I managed to write around 700 words without talking about the title of this article- if you are still with me, tip of the hat 🤠
So, Standard deviation is simply saying- “For this set of observations, there is this much deviation from the typical behaviour”
So, Standard deviation is simply saying- “For this set of observations, there is this much deviation from the typical behaviour”
Let’s get a physical feel for “this much deviation”
Touch the tip of your index finger and thumb- the distance b/w them denoting the spread/deviation from the typical behaviour
Touch the tip of your index finger and thumb- the distance b/w them denoting the spread/deviation from the typical behaviour
For 3 children- all 5 years of age, can you move your index finger away from the thumb to represent the spread from the typical behaviour?
If you didn’t move your index finger, you did well!
If you didn’t move your index finger, you did well!
It shouldn’t be moving because there’s no spread- The observations are all ensconced with the mean
What about children with ages 1y, 1y and 13y? Can you move the index finger to indicate the spread here?
What about children with ages 1y, 1y and 13y? Can you move the index finger to indicate the spread here?
Don’t worry about calculating the Standard deviation, jog with me on how to approach it
Step 1 - Identify the typical behaviour of the observations- We know the mean is 5 years
Step 2 - Visualise the three observations around the mean
Step 1 - Identify the typical behaviour of the observations- We know the mean is 5 years
Step 2 - Visualise the three observations around the mean
You can see that 13 is pretty far from the mean, and because we give louder voice to farther away points, the standard deviation will be heavily influenced by the (13y) observation
So we know the Standard deviation will be a big number. But how big?
Just move your finger to some arbitrary spread for now (and remember how much)
Just move your finger to some arbitrary spread for now (and remember how much)
Let’s repeat the above steps for another set — 4y, 5y and 6y
Now, I am assuming that the spread you did for (4,5,6) was definitely less than that for (1,1,13), right?
Now, I am assuming that the spread you did for (4,5,6) was definitely less than that for (1,1,13), right?
Did you also realise- You didn’t actually need to calculate the Standard deviation, you could just feel that (4,5,6) is less spread out, compared to (1,1,13)?
Feel that hi-five coming you way too!
Feel that hi-five coming you way too!
Enough about mean, average, standard deviation and age of children.
Let’s talk about sports 🎾 and a practical application of why we care about “deviation from typical behaviour”
Let’s talk about sports 🎾 and a practical application of why we care about “deviation from typical behaviour”
I am going to show you the average first serve speed of few players from 2019 Mens Wimbledon matches; you need to tell me your choice of player if what you cared about was first serve speed
This is easy, right?
***Some of the data is fictional
This is easy, right?
***Some of the data is fictional
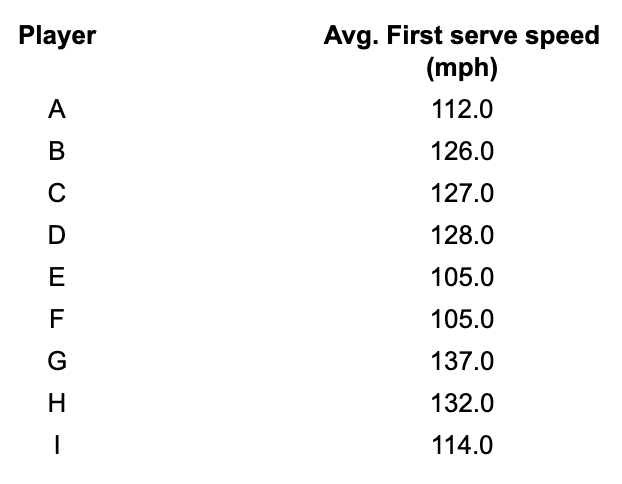
I think all of us agree it is player G (highlighted in green below)
Remember that whole “averages only tell the opening act of a story?” bit?
What if Player G has the highest average, but not the required consistency? Do we care about it? And if we do, how do we account for it?
Remember that whole “averages only tell the opening act of a story?” bit?
What if Player G has the highest average, but not the required consistency? Do we care about it? And if we do, how do we account for it?

In other words, can we think of some other measure that summarises consistency from the underlying observations- which in turn means less deviation from the typical behaviour- which in turn means Standard deviation!
There, now we have the Standard deviation too
There, now we have the Standard deviation too
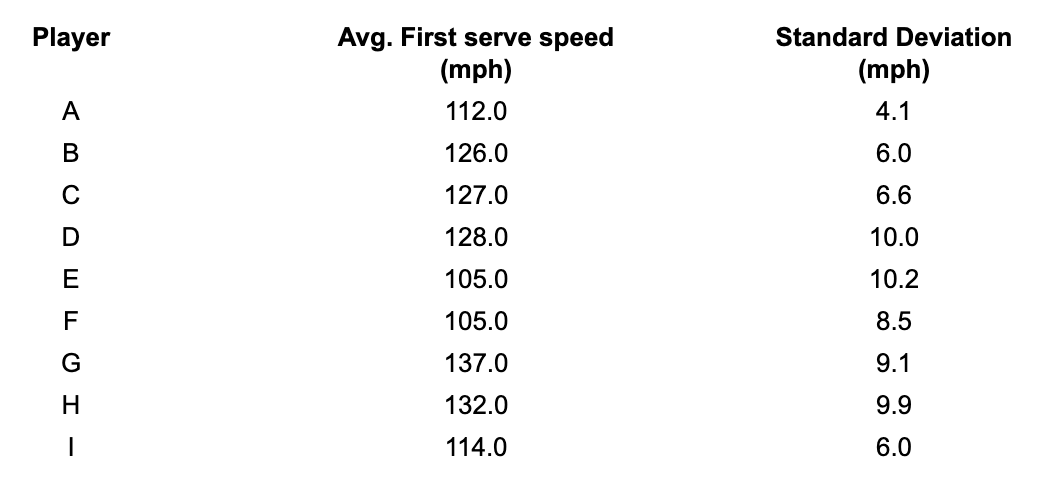
Let’s plot this
So we can see Player G has the highest overall average, but also very high Standard deviation — In simple words, Player G is a high performer, but not very consistent with his performance
So we can see Player G has the highest overall average, but also very high Standard deviation — In simple words, Player G is a high performer, but not very consistent with his performance
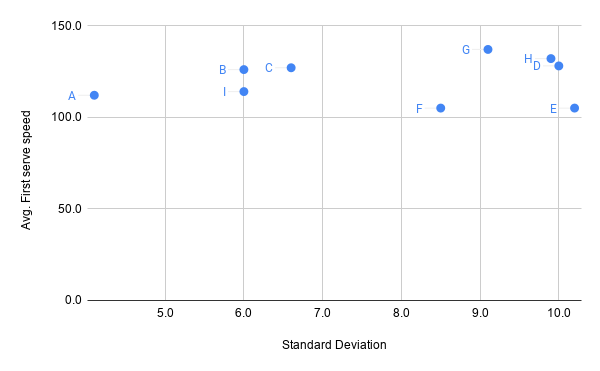
Would you change your earlier answer from Player G, now that you know there are other players who might not be as fast as Player G, but far more consistent?*
Do you see how with only averages as the single summary, this dilemma wasn’t even faced- We just unanimously answered Player G
*Drop in a comment with your replies (from the previous tweet)
*Drop in a comment with your replies (from the previous tweet)
In summary, we saw while averages tend to inform the typical behaviour/performance, they don’t talk about the deviation from the typical behaviour. For that, you need another measure, which is nothing but Standard deviation.
We also saw how Standard deviation allows us to weigh our trade-off decisions while comparing b/w performance and consistency of performance
There will be a part 2 for this series soon, in which will talk about
1. The 68–95–99 rule for Standard deviation - This is very interesting because with this rule, we can answer questions like...(next tweet)
1. The 68–95–99 rule for Standard deviation - This is very interesting because with this rule, we can answer questions like...(next tweet)
If Federer has an average first serve speed of 116 mph, with Standard deviation of 6 mph, what are the chances that Federer can hit a first serve at 125 mph?
2. Why do we use (n-1) instead of (n) for calculating Standard deviation of samples
This might be a little too detailed for some, however, as decision makers who try to help our users, we owe it to ourselves to understand the very basics of being data informed
This might be a little too detailed for some, however, as decision makers who try to help our users, we owe it to ourselves to understand the very basics of being data informed
Thank you for reading/scrolling till the end, I hope you liked it- The next time someone quotes averages, remember, that’s just the opening act! Dig in deeper :)
You can find the entire article in my blog at liminal.substack.com/p/developing-i…
You can find the entire article in my blog at liminal.substack.com/p/developing-i…
This blog is a reflection of my endeavours to learn and write about concepts that I find interesting. I try to write in a way that’s more visual and has less jargons (I hate them)
If you subscribe, you can expect not more than one article every fortnight- Some of the future topics range from Balance Sheet, Confusion Matrix, Gradient Descent from scratch on excel & one that I am particularly excited about - What are leaves shaped like how they are
👋
👋

