Memphis/Shelby County Covid Update
tl;dr
- record 363 new cases/day this wk
- that's up 15% over 2wks ago
- but testing down 6% (big problem)
- record 15.1%pos
- hosp/icu at 90%
- crisis!
- white house team said we must limit gatherings to 10 ppl
- we must move to phase1 now
1/
tl;dr
- record 363 new cases/day this wk
- that's up 15% over 2wks ago
- but testing down 6% (big problem)
- record 15.1%pos
- hosp/icu at 90%
- crisis!
- white house team said we must limit gatherings to 10 ppl
- we must move to phase1 now
1/

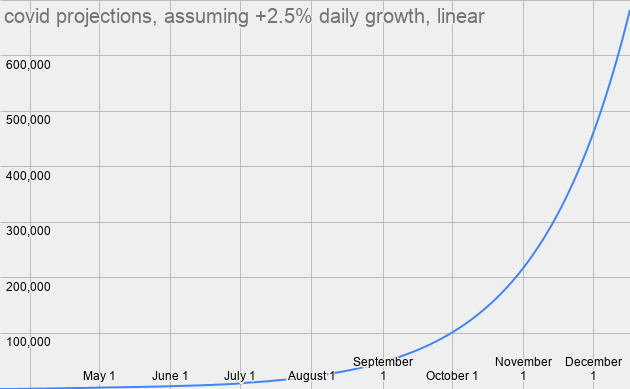
covid projections (not predictions)
- we are growing at a 2.5% daily rate
- play that out, and today's 16k total cases doubles to 32k by aug16
- that doubles to 64k by sept13
- doubles to 128k by oct11
- doubles to 256k by nov8
- doubles to 512k by dec6
- and 1M by jan2
2/
- we are growing at a 2.5% daily rate
- play that out, and today's 16k total cases doubles to 32k by aug16
- that doubles to 64k by sept13
- doubles to 128k by oct11
- doubles to 256k by nov8
- doubles to 512k by dec6
- and 1M by jan2
2/
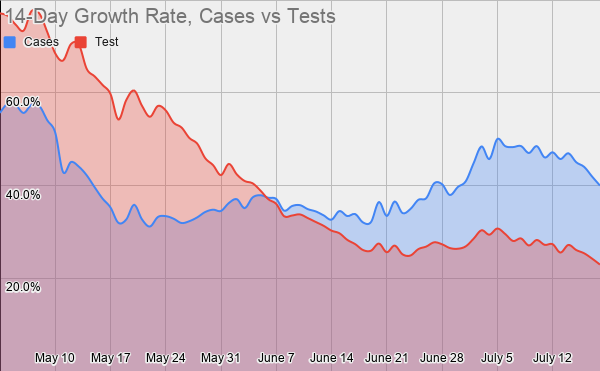
covid case growth vs test growth
- testing is a big problem
- the shape of case growth mirrors the shape of testing growth
- but it's just false to say that case growth is caused by testing
- you can clearly see that cases are growing much faster (74% faster, in fact)
3/
- testing is a big problem
- the shape of case growth mirrors the shape of testing growth
- but it's just false to say that case growth is caused by testing
- you can clearly see that cases are growing much faster (74% faster, in fact)
3/
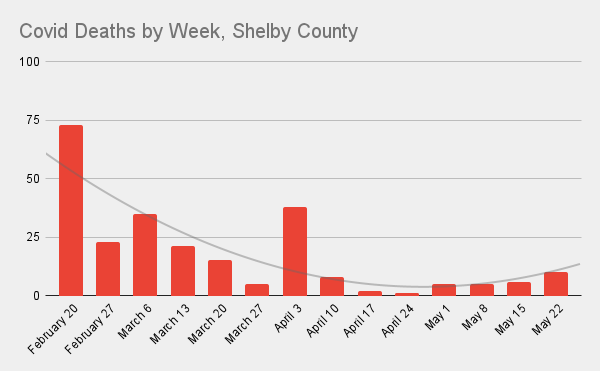
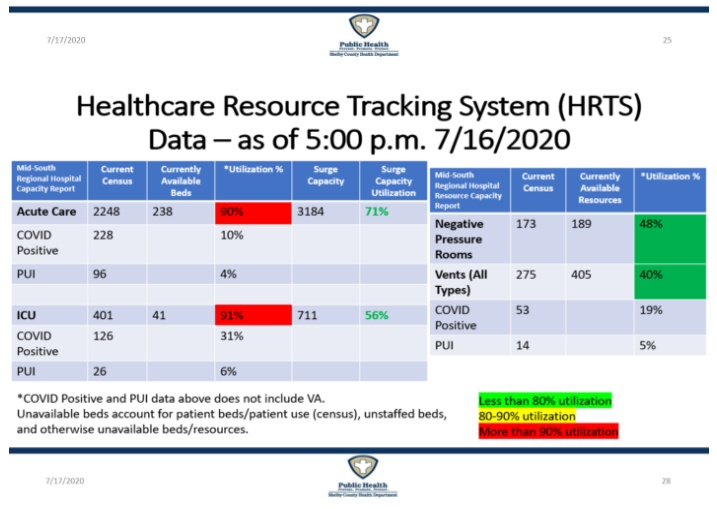
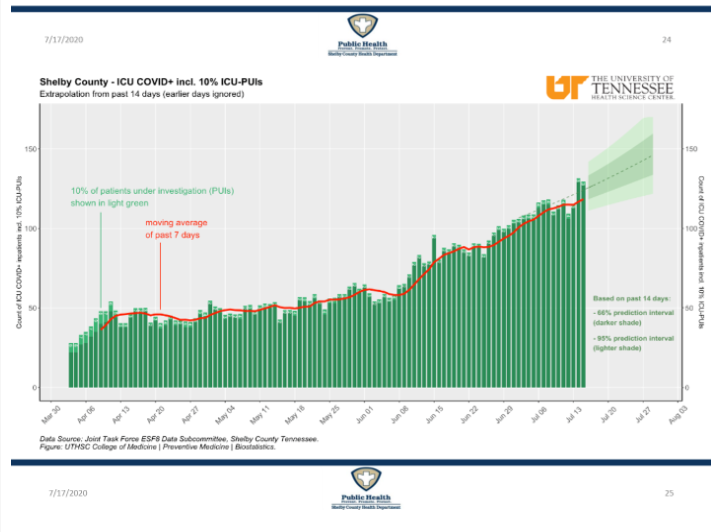
hospitalization
- note that we are in the RED for both acute care beds and icu beds
- we have plenty of surge capacity, but it's clearly bad if you have to use that
- the goal should to prevent the spread of the virus, not if we can respond when ppl get sick
4/
- note that we are in the RED for both acute care beds and icu beds
- we have plenty of surge capacity, but it's clearly bad if you have to use that
- the goal should to prevent the spread of the virus, not if we can respond when ppl get sick
4/
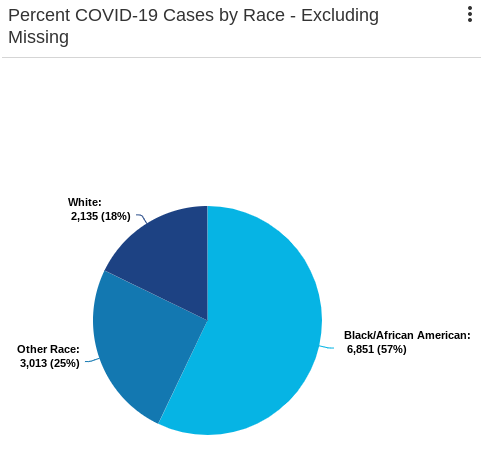
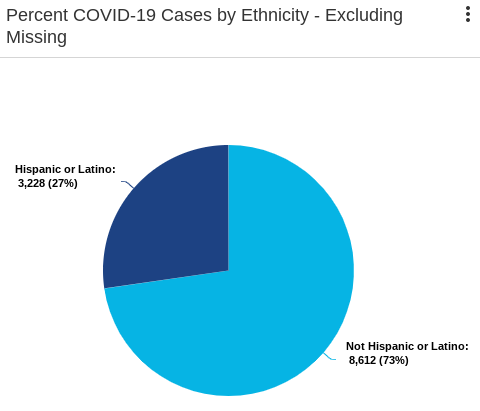
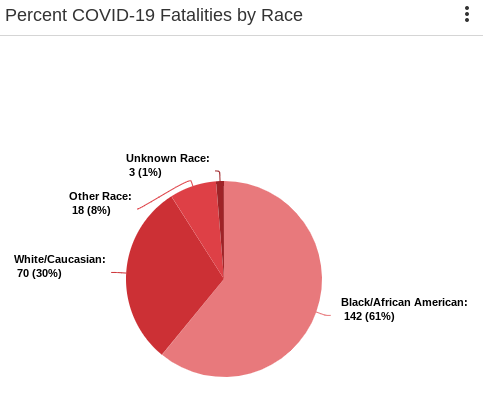
race/ethnicity
- the reason it's so important to change the goal to prevention is bc ppl are dying, Black & Latinx ppl in particular
- Black & Latinx Memphians are disproportionately impacted
- allowing the virus to spread is racist, period
5/
- the reason it's so important to change the goal to prevention is bc ppl are dying, Black & Latinx ppl in particular
- Black & Latinx Memphians are disproportionately impacted
- allowing the virus to spread is racist, period
5/
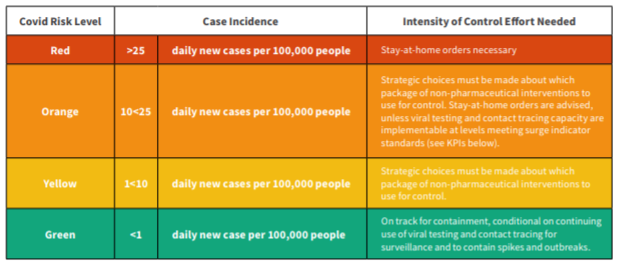
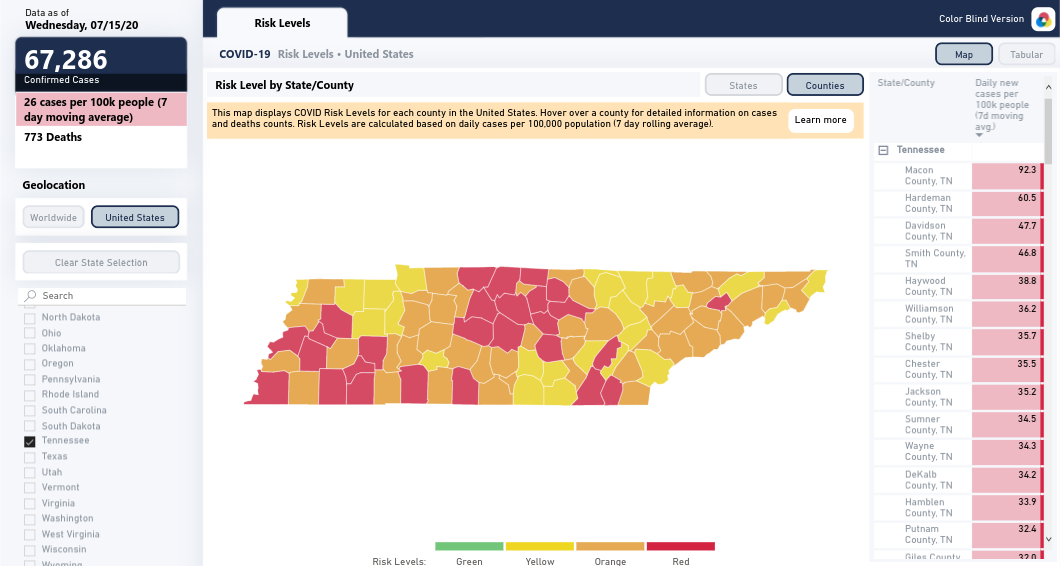
risk level
- but the virus continues to spread nonetheless
- in fact, it's out of control
- according to harvard global health, stay-at-home orders are necessary at 25 daily cases per 100k ppl
- we passed that 2wks ago
- we're at 37.8 per 100k
6/
- but the virus continues to spread nonetheless
- in fact, it's out of control
- according to harvard global health, stay-at-home orders are necessary at 25 daily cases per 100k ppl
- we passed that 2wks ago
- we're at 37.8 per 100k
6/
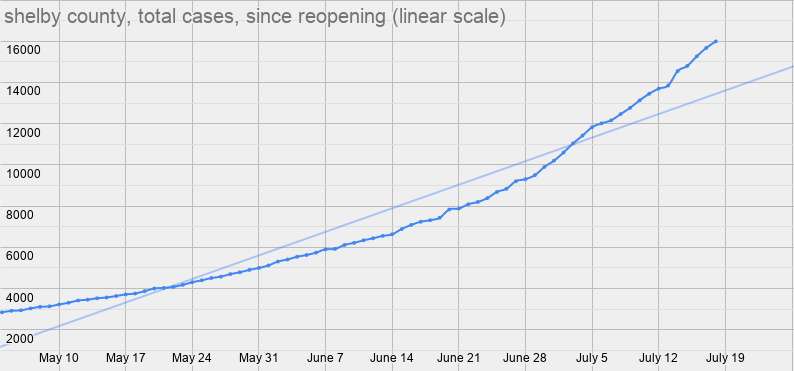
total covid cases, linear scale
- you can see the graph of cases continue to rise off the trendline
- and look at the shape of the graph, watch how it curves up
- that's bad, that's exponential growth
7/
- you can see the graph of cases continue to rise off the trendline
- and look at the shape of the graph, watch how it curves up
- that's bad, that's exponential growth
7/
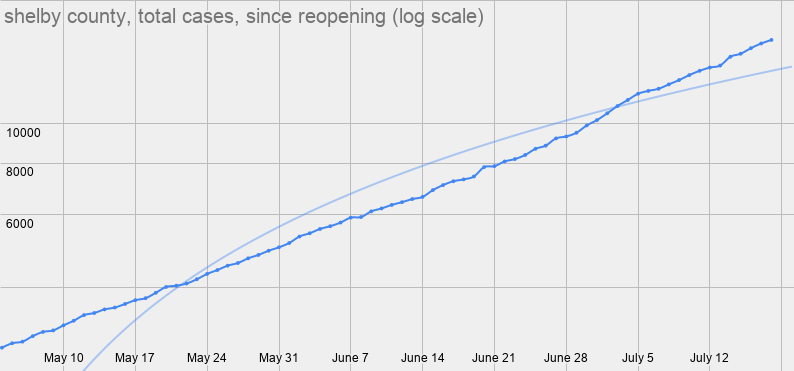
total covid cases, log scale
- remember "flatten the curve"?
- does this curve look flat to you?
- again, exponential growth
- this is bad
8/
- remember "flatten the curve"?
- does this curve look flat to you?
- again, exponential growth
- this is bad
8/
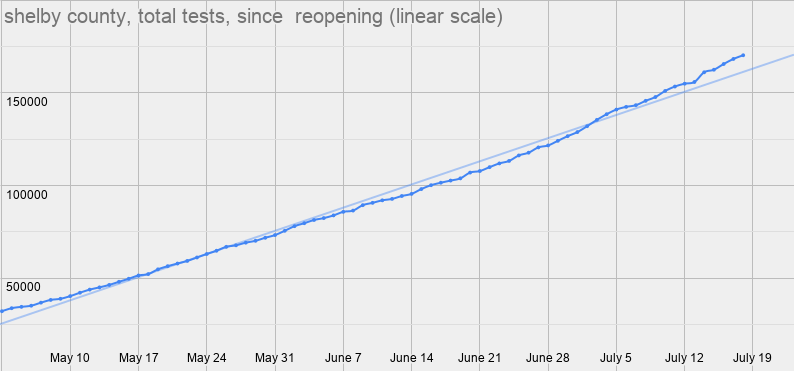
total covid tests
- meanwhile, you can see that the graph of total tests stays pretty close to the linearly trendline
9/
- meanwhile, you can see that the graph of total tests stays pretty close to the linearly trendline
9/
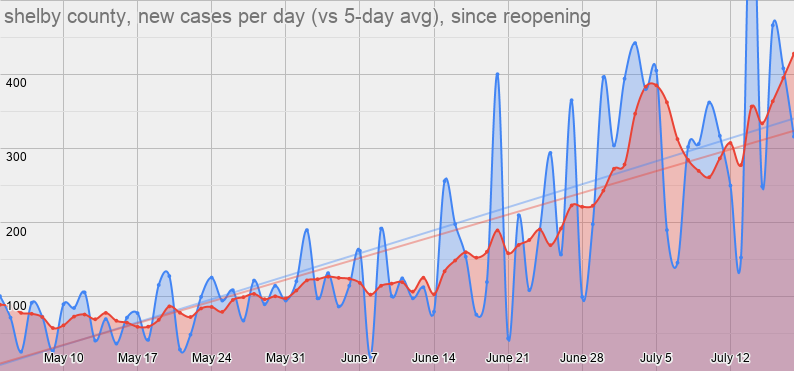
new covid cases per day
- on may18, we had 60 new cases/day
- on june18, we were at 153
- on july18, we're up to 428
- that's just incredible (and scary) growth
10/
- on may18, we had 60 new cases/day
- on june18, we were at 153
- on july18, we're up to 428
- that's just incredible (and scary) growth
10/
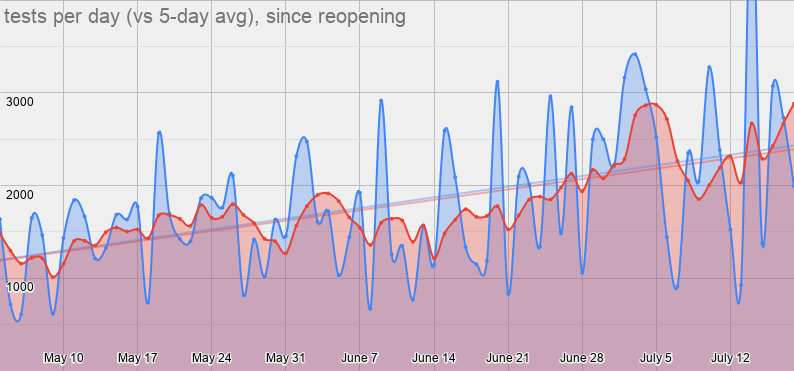
covid tests per day
- meanwhile, testing is not keeping up with case growth
- may18, 1432 tests/day
- june18, 1663
- july18, 2882
- testing has doubled in the past two months
- that sounds good, but we have 7x as many new cases
11/
- meanwhile, testing is not keeping up with case growth
- may18, 1432 tests/day
- june18, 1663
- july18, 2882
- testing has doubled in the past two months
- that sounds good, but we have 7x as many new cases
11/
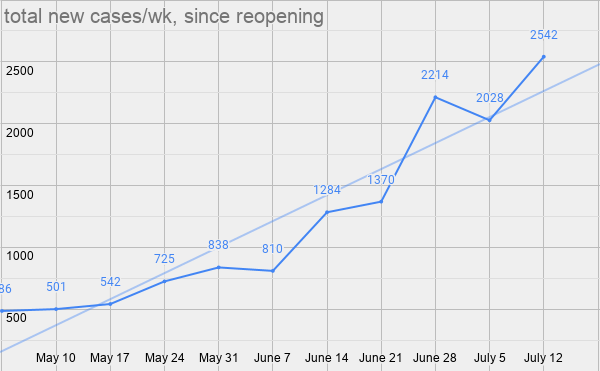
total covid cases per wk
- we set a new record at 2542
- up 25% over last wk
- up 15% over 2wks ago, previous high
- up 98% over 4wks ago
- up 369% over wk of phase2
- up 423% over wk of phase1
12/
- we set a new record at 2542
- up 25% over last wk
- up 15% over 2wks ago, previous high
- up 98% over 4wks ago
- up 369% over wk of phase2
- up 423% over wk of phase1
12/
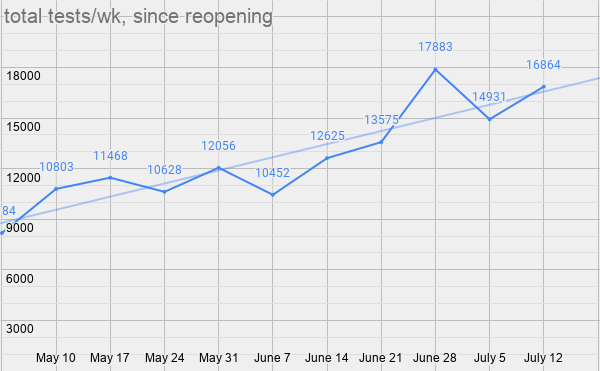
total covid tests per wk
- up 13% over last wk
- but down 6% over 2wks ago
- up 34% over 4wks ago
- up 47% over wk of phase2
- up 106% over wk of phase1
- compare this w/case growth above
- testing is just not keeping up
- this is a huge problem
13/
- up 13% over last wk
- but down 6% over 2wks ago
- up 34% over 4wks ago
- up 47% over wk of phase2
- up 106% over wk of phase1
- compare this w/case growth above
- testing is just not keeping up
- this is a huge problem
13/
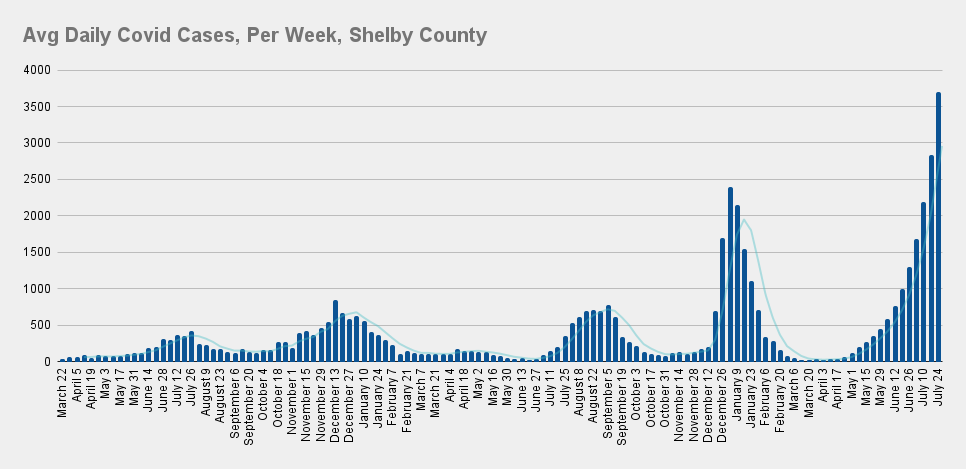
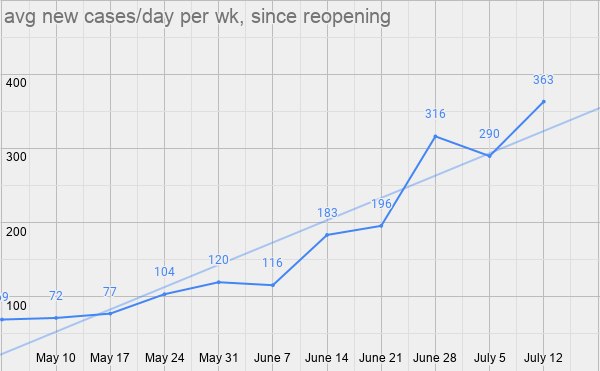
avg new covid cases/day per wk
- we added 363 cases each day this wk
- for context, we had just 486 cases the entire wk of may3, the wk we reopened to phase1
14/
- we added 363 cases each day this wk
- for context, we had just 486 cases the entire wk of may3, the wk we reopened to phase1
14/
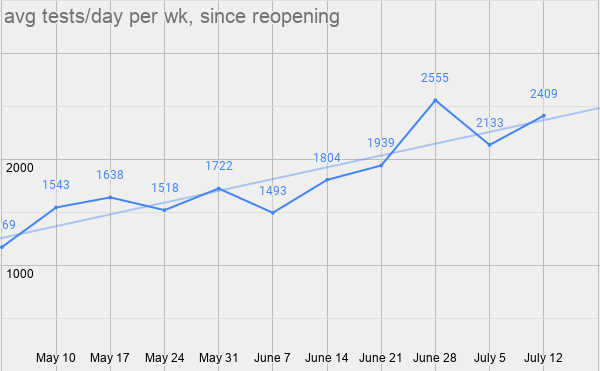
avg covid tests/day per wk
- first, look at the slope of the trendline here compared to the slope of the trendline of cases above
- then look at how this wk sits right on the trendline for tests, but lifts far above the trendline for cases
- testing just can't keep up
15/
- first, look at the slope of the trendline here compared to the slope of the trendline of cases above
- then look at how this wk sits right on the trendline for tests, but lifts far above the trendline for cases
- testing just can't keep up
15/
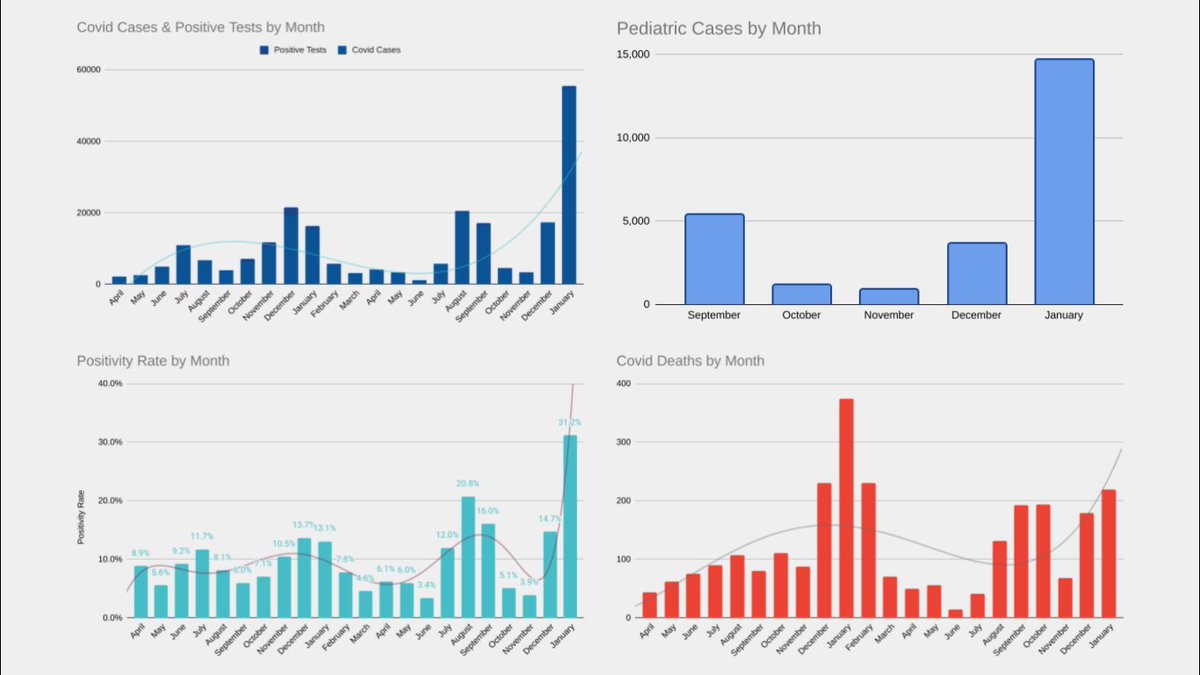
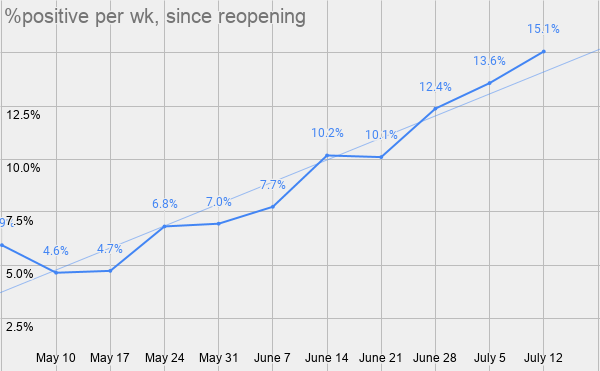
covid positivity rate
- another record high wk, at 15.1%
- the bar for containing the virus is 3%
- anything above 10% means we are missing a significant number of cases
- and that means ppl are walking around spreading the virus
16/
- another record high wk, at 15.1%
- the bar for containing the virus is 3%
- anything above 10% means we are missing a significant number of cases
- and that means ppl are walking around spreading the virus
16/
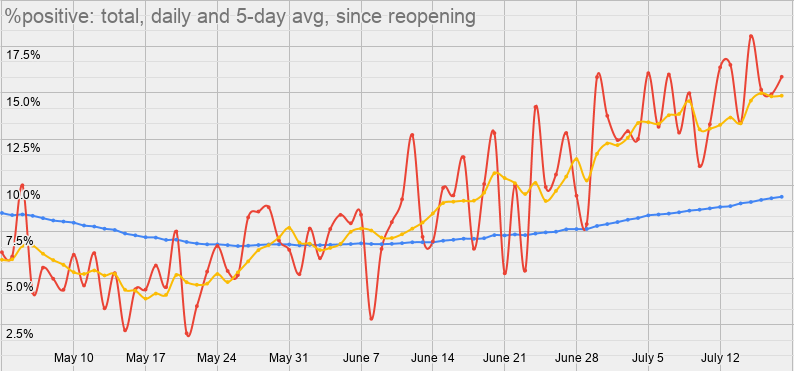
covid positivity rate
- we've been over 10% for 19 straight days, since jun30
- we were over 15% five days this wk (and one day was 14.9%)
- overall pos is up to 9.4%, highest since apr21
- 1wk ago, 8.8%
- 2wks, 8.3%
- 3wks, 7.6%
- 4wks, 7.3%
17/
- we've been over 10% for 19 straight days, since jun30
- we were over 15% five days this wk (and one day was 14.9%)
- overall pos is up to 9.4%, highest since apr21
- 1wk ago, 8.8%
- 2wks, 8.3%
- 3wks, 7.6%
- 4wks, 7.3%
17/
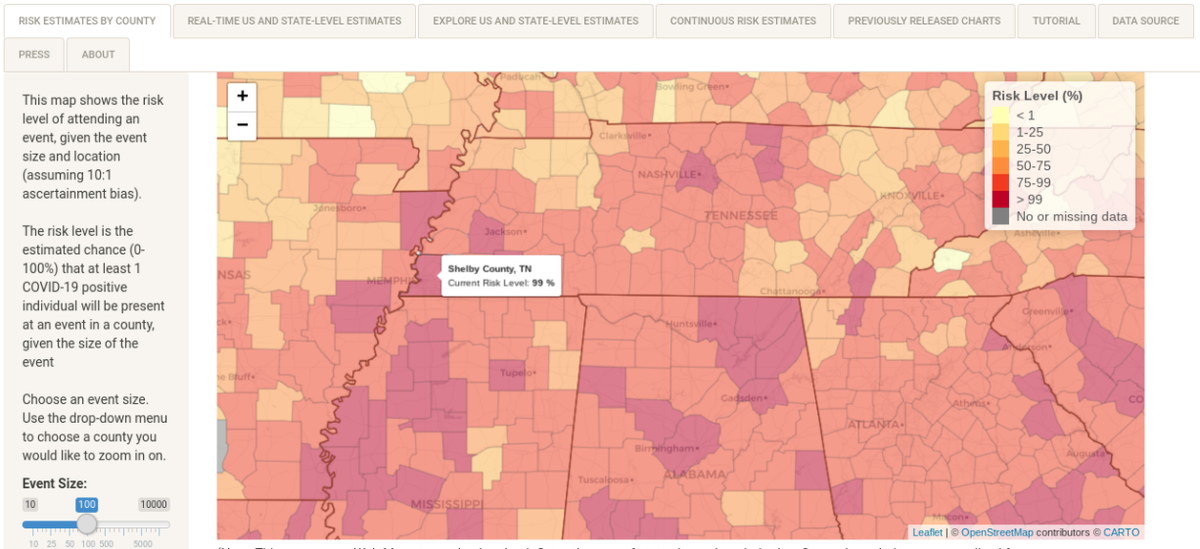
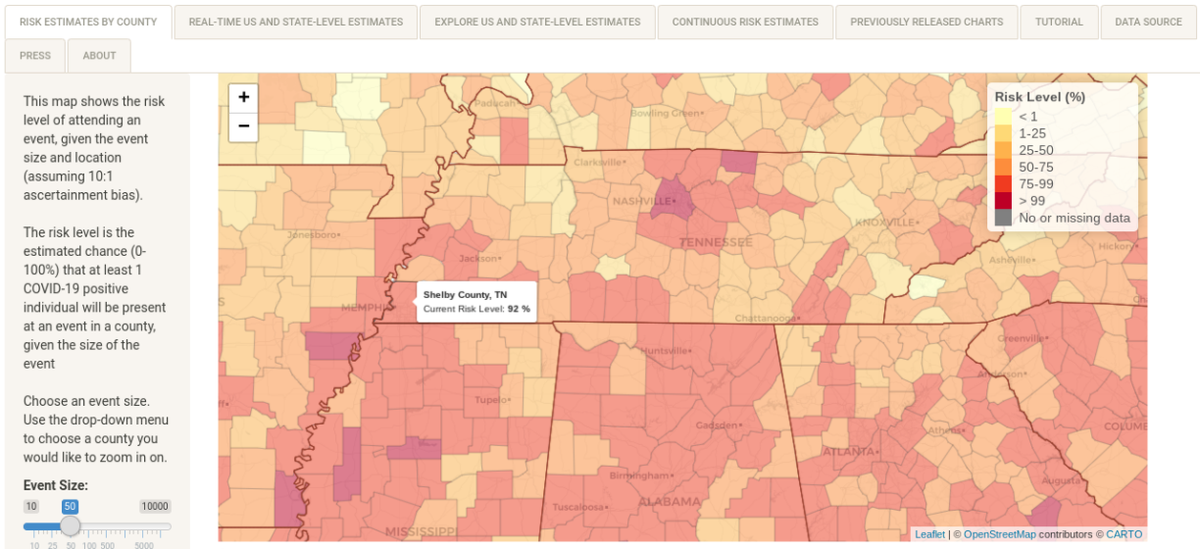
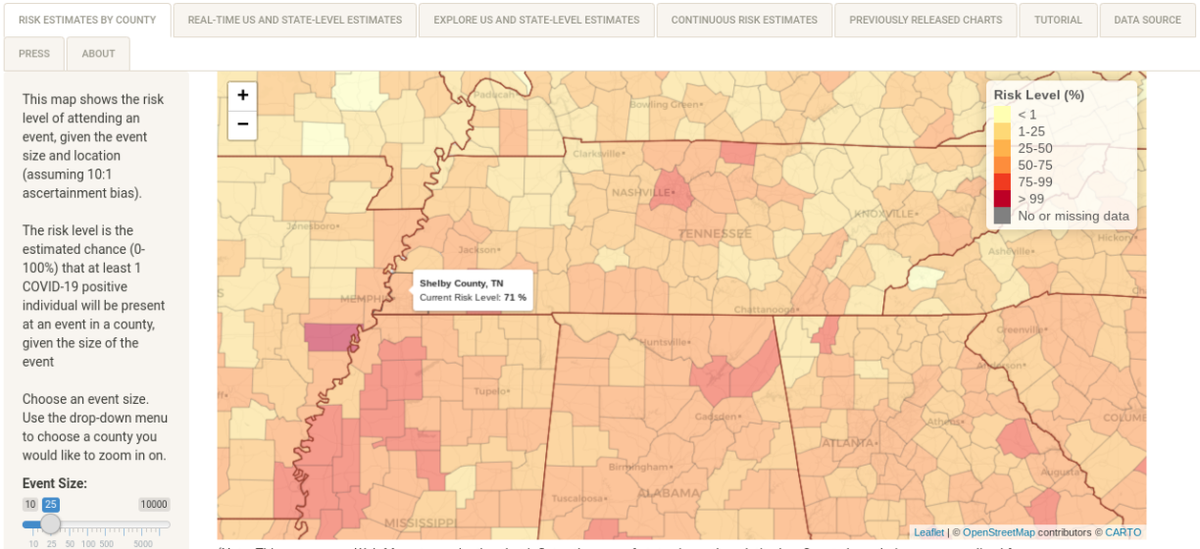
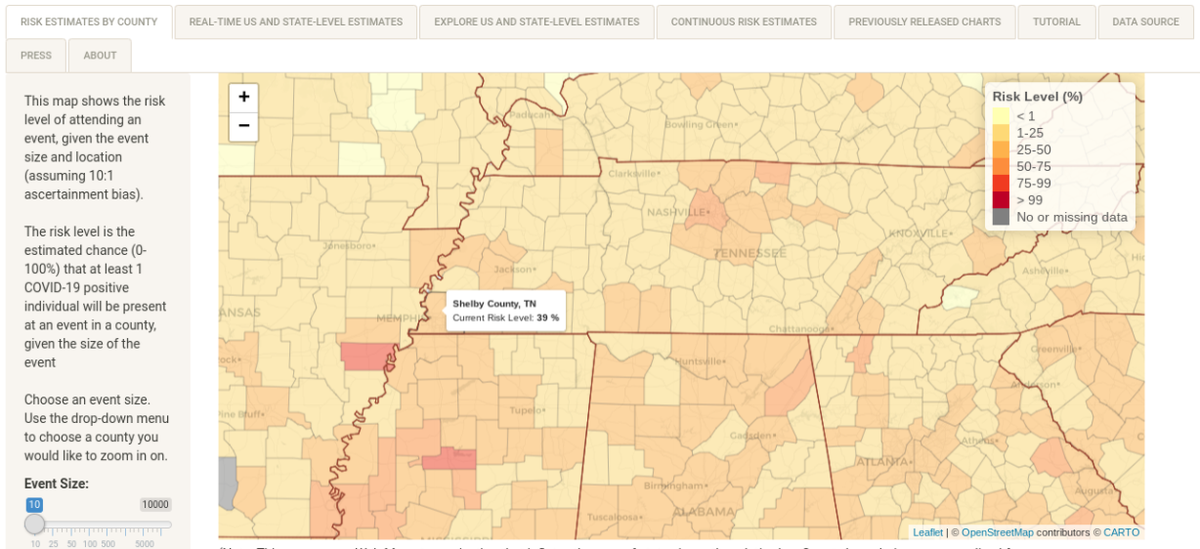
risk levels
- this from @GeorgiaTech is really helpful
- gather 100 ppl & there's a 99% chance someone has covid
- gather 50, it's 90%
- gather 25, it's 69%
- gather 10, it's 38%
18/
- this from @GeorgiaTech is really helpful
- gather 100 ppl & there's a 99% chance someone has covid
- gather 50, it's 90%
- gather 25, it's 69%
- gather 10, it's 38%
18/
i wish i could include a screenshot of the back to biz dashboard
- but the website no longer exists
- it went offline as soon as we hit RED for every indicator
backtobusiness.memphistn.gov
19/
- but the website no longer exists
- it went offline as soon as we hit RED for every indicator
backtobusiness.memphistn.gov
19/

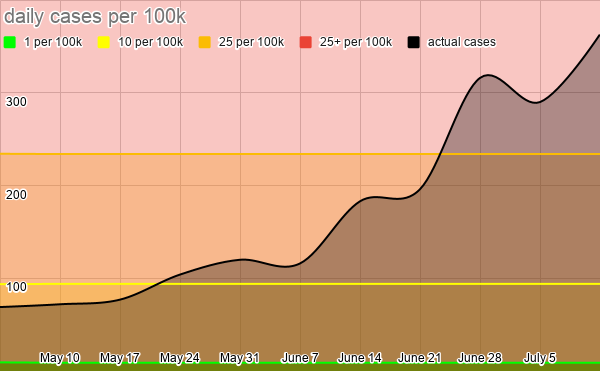
daily cases per 100k ppl
- the RED section is where harvard global health says stay-at-home orders are necessary
- we've been in the RED for over 2wks now
- we *must* get back down to the YELLOW
- and that means moving back to phase1
20/
- the RED section is where harvard global health says stay-at-home orders are necessary
- we've been in the RED for over 2wks now
- we *must* get back down to the YELLOW
- and that means moving back to phase1
20/
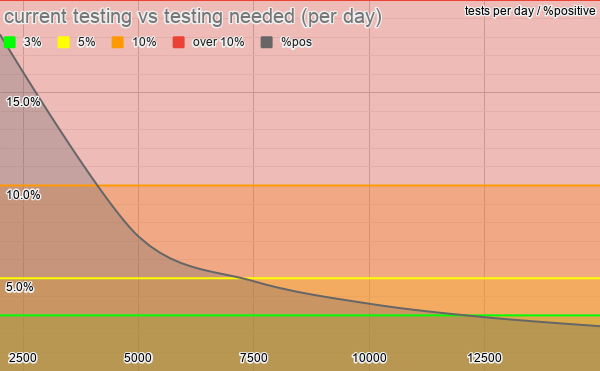
positivity rate
- harvard's bar for suppression is 3%
- to get there, we need 5x more testing
- we avg'd 2,409 tests/day this wk, with 15.1%pos
- we'd need 3,650 to get down under 10%pos
- we'd need 7,400 to get under 5%pos
- we'd need 12,500 to get under 3%pos
21/
- harvard's bar for suppression is 3%
- to get there, we need 5x more testing
- we avg'd 2,409 tests/day this wk, with 15.1%pos
- we'd need 3,650 to get down under 10%pos
- we'd need 7,400 to get under 5%pos
- we'd need 12,500 to get under 3%pos
21/
reopening schools
- without meeting those 2 data points (under 10 daily cases per 100k + under 3%pos), we can't even discuss reopening schools
22/
- without meeting those 2 data points (under 10 daily cases per 100k + under 3%pos), we can't even discuss reopening schools
22/

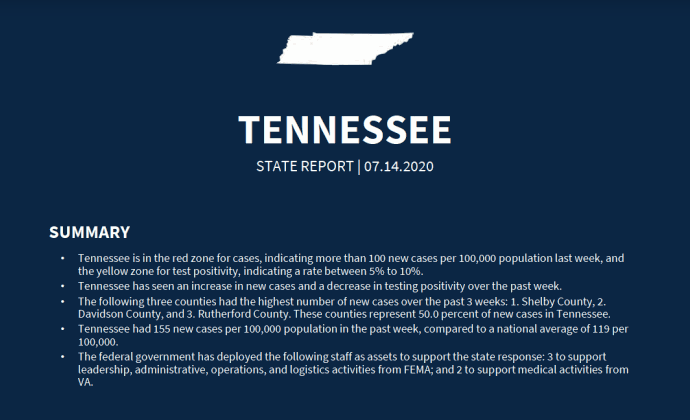
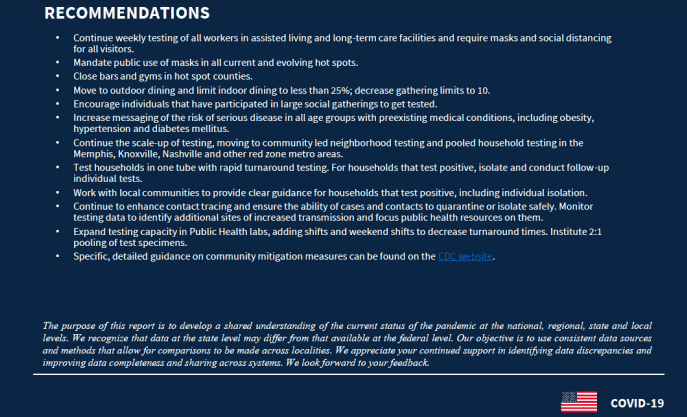
the white house sent a team to shelby county last week
- our leaders didn't tell us what was said
- but fortunately the recs leaked
- and the recs say we should limit gatherings to 10 ppl
- you can't have school if you can't gather more than 10 ppl
23/
- our leaders didn't tell us what was said
- but fortunately the recs leaked
- and the recs say we should limit gatherings to 10 ppl
- you can't have school if you can't gather more than 10 ppl
23/
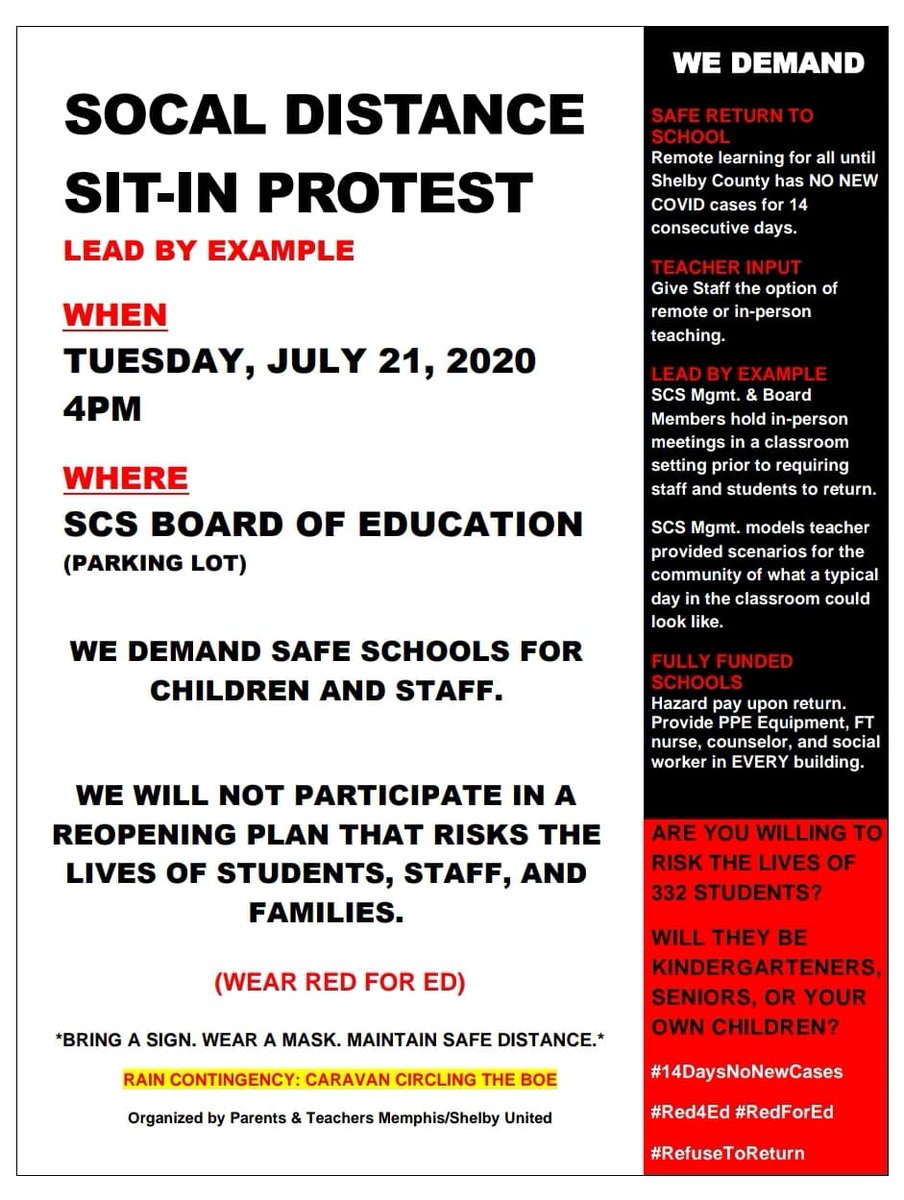
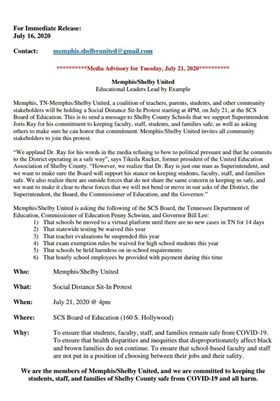
join memphis/shelby united to demand safe schools
WHAT: social distance sit-in
WHEN: tueday, july21, 4:00pm
WHERE: scs board of ed parking lot
WHY: protect students, families, teachers, staff
24/
WHAT: social distance sit-in
WHEN: tueday, july21, 4:00pm
WHERE: scs board of ed parking lot
WHY: protect students, families, teachers, staff
24/
if you appreciate my work, please donate something to @LifeLineSuccess. i will personally vouch for @ministerdbrown & @mrsvjbrown. i've partnered with them for over 10 yrs now.
they need new mowers & are almost 1/3 the way there.
every bit counts.
charity.gofundme.com/o/en/campaign/…
25/
they need new mowers & are almost 1/3 the way there.
every bit counts.
charity.gofundme.com/o/en/campaign/…
25/
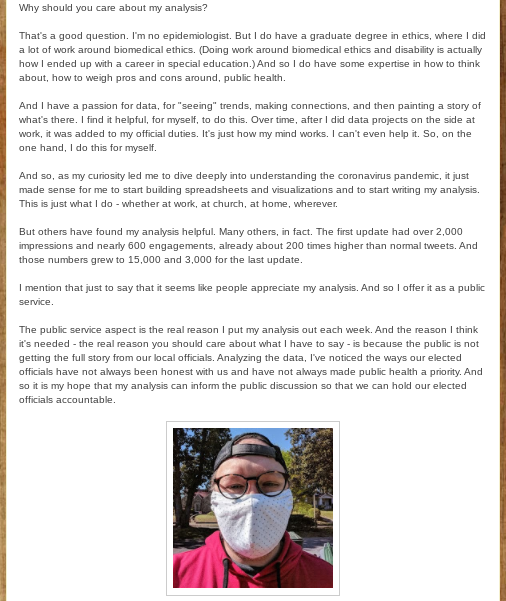
finally, check out this interview i did with @TobySells in the @MemphisFlyer.
memphisflyer.com/memphis/data-d…
~ fin ~
27/27
memphisflyer.com/memphis/data-d…
~ fin ~
27/27
• • •
Missing some Tweet in this thread? You can try to
force a refresh