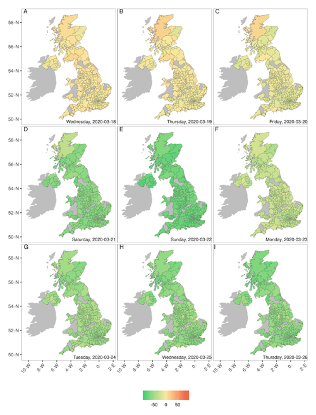
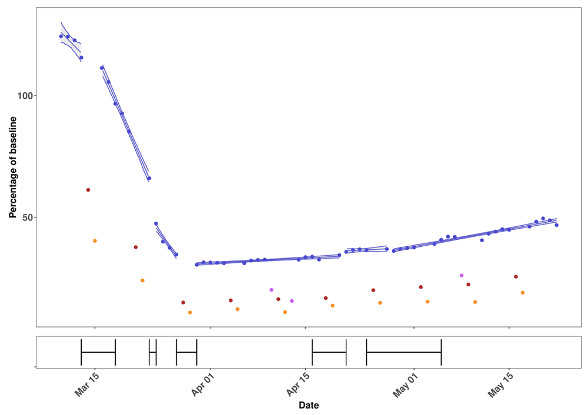
We used data from @Facebook and a UK mobile phone provider and found synchronised mobility patterns all across the UK (regardless of data source or geographic region). The largest reduction in mobility occurred around the time of the announcement of lockdown. (2/6)
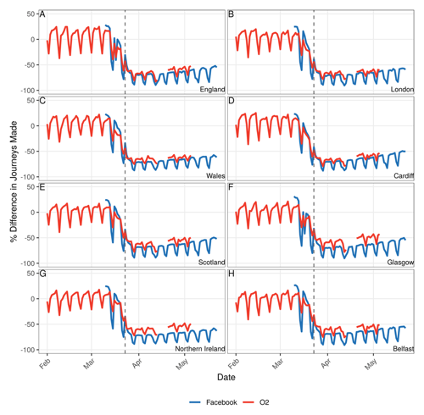
Although mobility remained low since 26 March, we detected a gradual increase in mobility throughout the lockdown period. (3/6)
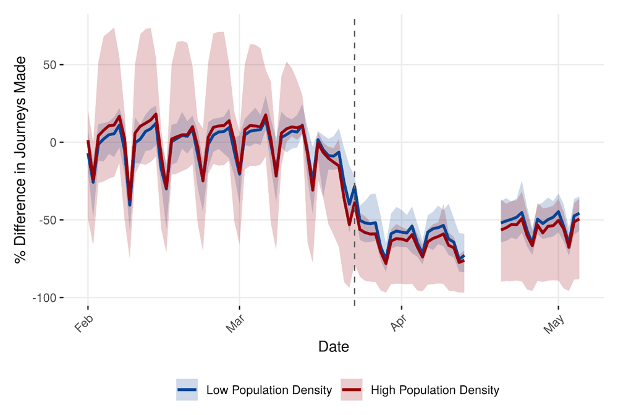
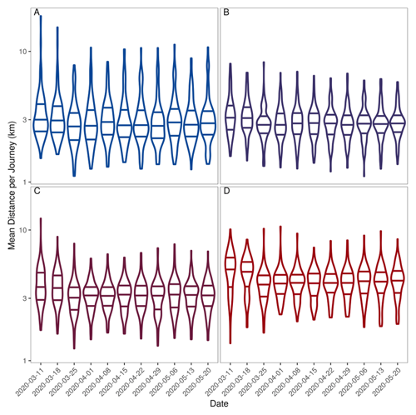
We observed slightly larger reductions in average mobility and greater variation in mobility in high-density areas compared to low-density areas: some high-density areas eliminated almost all mobility. Range of journey distance was greater in the lowest density populations.(4/6)
Limitations:
- Data were only reported for locations with sufficient coverage (approximately 90%) of UK LADs
- It is difficult to assess how representative our data are of the wider population.
- The data may not always capture the true changes in social contact behaviour. (5/6)
These analyses form a baseline from which to observe changes in behaviour in the UK as social distancing is eased and inform policy towards the future control of SARS-CoV-2 in the UK. (6/6)
• • •
Missing some Tweet in this thread? You can try to
force a refresh
Results
- We found 821 positives from 105,123 swabs
- Unweighted prevalence of 0.78% (95% CI, 0.73%, 0.84%)
- Weighted prevalence of 0.96% (0.87%, 1.05%)
- The weighted prevalence estimate was ~30% lower than that of 1.32% (1.20%, 1.45%) obtained in the second half of round 6
The decrease in prevalence corresponds to a halving time of 37 (30, 47) days and an R = 0.88 (0.86, 0.91).
Using only data from the most recent period, we estimate an R = 0.71 (0.54, 0.90).
A spline fit to prevalence showed a fall coinciding w/ start of lockdown.
REACT-1 study update: Prevalence of swab positivity had increased to over 1 in 200 in England as of 26 Sep 2020. Weighted prev = 0.55% (0.47%, 0.64%). This implies 411,000 (351,000, 478,000) people are virus-positive.
Main results:
- 363 positives from 84,610 samples
- Weighted prev = 0.55% (0.47%, 0.64%)
- This continues upwards trend in prevalence seen since mid-Aug
- Highest observed prev since beginning of study in May 2020 & more than a four-fold increase in weighted prev observed in r4
- We estimate doubling time of 10.6 (9.4, 12.0) days from 20 Aug to 26 Sep
- This corresponds to a R of 1.47 (1.40, 1.53)
- Using data only from round 5 (18 Sep to 26 Sep) we estimate a R of 1.06 (0.74, 1.46) with probability of 63% that R is greater than 1.
Our latest results from the REACT-1 study show that prevalence of #COVID19 is increasing in England. Main results are highlighted below.
The full (not yet peer reviewed) pre-print is available here: tinyurl.com/y3jw765x (1/n)
The epidemic declined between rounds 1 and 2, and 2 and 3, but was increasing between rounds 3 and 4: doubling time 17 (13, 23) days and R=1.3 (1.2, 1.4)
From the most recent round 4 data (22nd August and 7th September): doubling time 7.7 (5.5, 12.7) days and R=1.7 (1.4, 2.0)
Over all four rounds of the study, we found that 72% (67%, 76%) of swab-positive individuals were asymptomatic at the time of swab and in the week prior.
Our data were suggestive of a higher rate of asymptomatic swab-positivity in children compared to adults.
Prevalence of #COVID19 in England is trending downward. Our new preprint on REACT 1 study found continued decline in prevalence and a shift in pattern of infection by age and occupation at end of initial lockdown in England. (1/n) @SRileyIDD@DrCWalters tinyurl.com/y6xzjppj
- Over both rounds combined, we estimate an
- average halving time of 38 (28, 58) days
- reproduction number (R) of 0.89.
- The proportion of asymptomatic swab-positive participants at the time of sampling increased from 69% (round 1) to 81% (round 2).
- Health care/care home workers were infected more frequently than other workers in round 1, but not in round 2
- Prevalence in 18-24 year olds reduced markedly between rounds
- Our data suggested increased risk of infection in Black and Asian (mainly South Asian) ethnicities
Using daily reported cases from mainland China and Hong Kong SAR, we estimated transmissibility over time and compared it to daily within-city movement, as a proxy for economic activity.
Initially, movement and transmission were very strongly correlated. However, that correlation decreased rapidly after the initial fall in transmissibility. In general, at the end of the study period the correlation was no longer apparent despite substantial increases in movement.