Scott Irwin Profile picture
Jul 20, 2020 8 tweets 3 min read Read on X
1. New #fdd last week on forecast performance of simple crop weather models in forecasting US average corn yield. Interesting exercise farmdocdaily.illinois.edu/2020/07/the-ac…
2. Compared 2 models for May-Aug early season yield forecasts of corn: i) WAOB/USDA model, and ii) a similar model that TH and I developed. We reviewed the WAOB model is this article a week ago: farmdocdaily.illinois.edu/2020/07/unders…
3. Both models include trend, planting progress/late planting, June precip, July precip, and July temps. Some differences in data definitions and variables. Biggest is the WAOB use of a June precip shortfall measure. We use a standard quadratic.
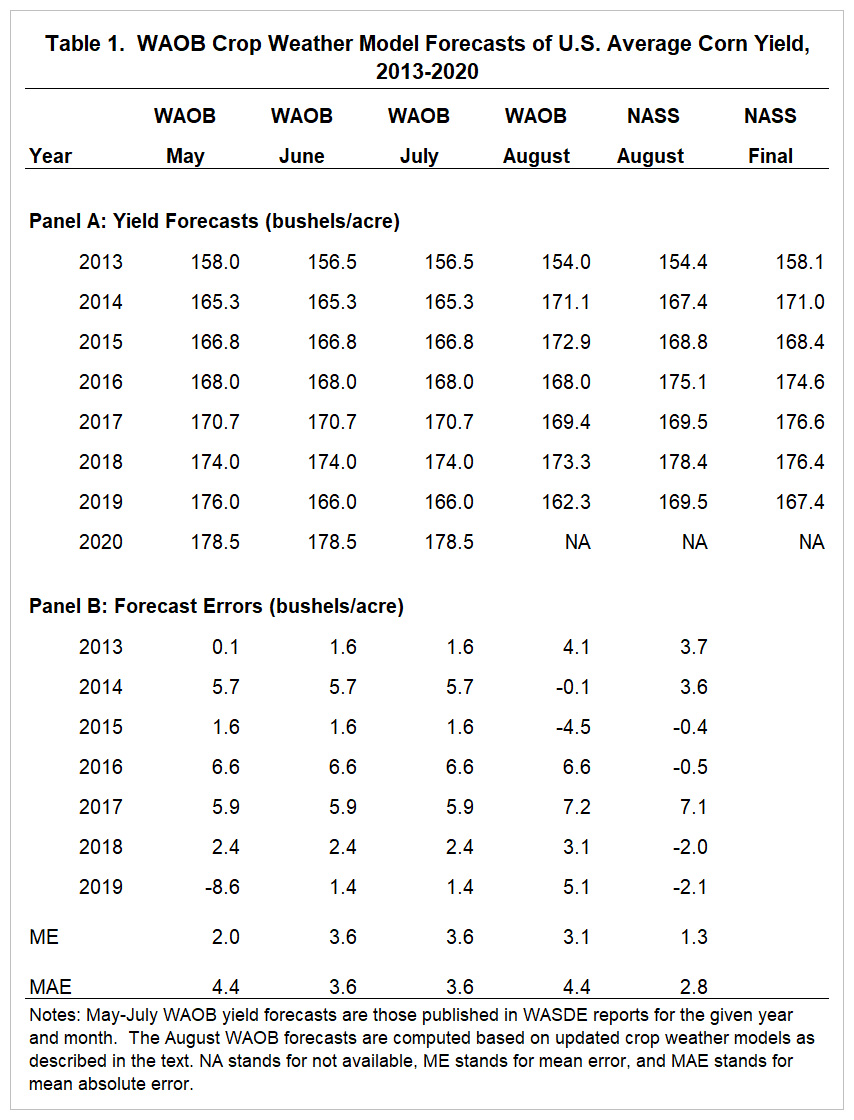
4. Here are the WAOB forecasts and forecast errors over 2013-2019. Started in 2013 because that was first year the WAOB used the model to make forecasts for the May, June, and July WASDE. Image
5. Most interesting thing about the WAOB crop weather model forecasts? I've been on the side that WAOB May-July corn yield forecasts in recent years have been on a shade optimistic when released. Wrong. ME (mean error) shows these "optimistic" forecasts were 2-3bpa too low. Image
6. Here are the parallel results for our simple crop weather model. Similar to WAOB model except for 2014. Our model made a huge forecast error that year, 20bpa too low! Ouch. Why? Our model puts more weight on July precip and it was oddly low in 2014 for a record yield. Image
7. Here the money chart from the article. Mean absolute errors (MAE) that show which forecasts were closest to the target (final yield). WAOB model clearly beat our modified version. And NASS August handily beats any of the models. Image
8. I think there is an important lesson here regarding NASS survey-based yield estimates in Aug-Nov. Lots of chatter that these are obsolete with the rise of "big data" private competitors. USDA/NASS not nearly as easy to beat as many think. Take that to the bank. Image

• • •

Missing some Tweet in this thread? You can try to force a refresh
 

Keep Current with Scott Irwin

Scott Irwin Profile picture

Stay in touch and get notified when new unrolls are available from this author!

Read all threads

This Thread may be Removed Anytime!

PDF

Twitter may remove this content at anytime! Save it as PDF for later use!

Try unrolling a thread yourself!

how to unroll video
  1. Follow @ThreadReaderApp to mention us!

  2. From a Twitter thread mention us with a keyword "unroll"
@threadreaderapp unroll

Practice here first or read more on our help page!

More from @ScottIrwinUI

Jul 12
1. We keep getting rain around here. About a half an inch last night. We are pushing 7 inches this week in Champaign County. I went out to what I call the Field of Dreams to walk our dog this morning and it is still hard to believe how good the corn and beans look. But, call me paranoid, this got me thinking about whether we were starting to get too much rain this month?
2. So, you know me, I ran back to my computer and starting digging out the data to check out the relationship between July precip and corn yields. I was relieved to see that, no, we are not in the territory of too much July precip. Image
3. Note that the y-axis is deviation from a simple linear trend over 1980-2023 for the Illinois state average yield. Precip is the average for the state too. The data scatter shows that there is no real dip in trend deviations all the way out to about 8 inches. I know the quadratic regression I used shows the yield deviation turning down above six inches of July precip but that is more the result of forcing this functional form on the data, which probably is better modeled by a linear function up to around 5 inches and then going flat.Image
Read 5 tweets
Jul 8
1. Man, I really hate to do this tonight after a day like this in the grain market. But we gotta start talking about the potential scale of financial losses for producing corn and soybeans in 2024. This is an updated budget from this FDD: farmdocdaily.illinois.edu/2024/06/revise…
Image
2. I am going to use the following yield/price combinations just to get the convo started. Corn: 240 bu./$3.70. Soybeans: 75 bu./$10.30. I use higher yield expectations based on the expectation that Beryl rains will go a long ways to improving prospects. Mr. Market sure thinks so. Without taking into account LDP and crop insurance proceeds, this results in estimated farmer returns of -$244/acre for corn and -$98/acre for soybeans. For farms with 50/50 rotations that results in average farmer returns for all acres of -$171 per acre.Image
3. We are getting close to where 85% crop insurance policies will trigger based on price alone. Feb price was $4.66. For the 85% policy, Dec 24 futures have to drop to $3.96 to trigger payments at APH yields. With the increased yields I used, looks like still aways to seeing insurance payments. But need to wait for my colleagues who are much more expert in this regard to chime in. My sense is that crop insurance right now is not likely to help much. I am not sure about ARC/PLC payments. Maybe more help there.
Read 5 tweets
Mar 20
1. I guess today is the day to talk about corn yields. Just received an email from @aaea announcing a new Choices article "A Slowdown in US Crop Yield Growth" by David Boussios. Here is the link: choicesmagazine.org/choices-magazi…
2. The author of the Choices article argues: "The statistical evidence of a productivity slowdown in crop yield growth builds each year. The linear yield growth trends since 2013 for corn, soybeans, and wheat are all statistically lower than one starting in 1988. Models, forecasts, market participants, and policy makers should consider that yields in the future will probably be lower than forecasted by the USDA and that extrapolating trends into the future without revision is problematic."
3. This argument is especially interesting because I have seen similar arguments in the grain trade in the last few years. We can all agree that the US average corn yield has been relatively flat since around 2013. That is obvious looking at a chart of corn yields. But one has to be extremely careful in then leaping to the conclusion that productivity growth in corn yields has also slowed. The reason is that runs of poor or good weather can mask the true underlying trend in small samples of years.
Read 7 tweets
Nov 1, 2023
1. Recommended Reading for the Day: Fascinating new FDD from my colleagues on the farmdoc team, led by Carl Zulauf. Long-term look at real crop prices. farmdocdaily.illinois.edu/2023/10/the-po…
2. It has long been a staple of economic thinking that real (inflation adjusted) commodity prices have a strong tendency to decline over time. Probably the most famous example of in this regard is the bet about real commodity prices between Julian Simon and Paul Ehrlich in 1980. See the details here:
3. Carl and team put together the data for a USDA index of real crop prices going back to 1912. This is the chart shown below. Lots of interesting history here, but the 30 year period of stable real crop prices that began around 1990 is unmistakable. The question is whether this is a pause in a very long run downward trend or something new.
Image
Read 8 tweets
Sep 28, 2023
1. Excited to announce that the band is back together! Actually, talked Darrel Good into coming out of retirement to work on this FDD: "The New Era of Crop Prices: A 15-Year Review." farmdocdaily.illinois.edu/2023/09/the-ne…
2. When crop prices started to take off in 2006-07, a huge question was whether this was just another spike like we had seen so many other times, or was this the beginning of a permanent jump in the level of average prices, like in 1973. Image
3. For some reason (temporary insanity?), Darrel and I decided to stick our necks out and predict that a new era in crop prices was afoot AND make specific predictions for the average price and trading range in the new era. As this chart shows, we did not have much data to go on.
Image
Read 8 tweets
Jun 1, 2023
1. Ok, I have hopefully convinced you that the RIN cliff scenario is a logical possibility. Now what are the chances of it actually happening? The first step is to estimate QM in the graph below. Turns out the proposed RVOs released by EPA last December are the place to start. Image
2. We can use the proposed RVOs to come up with a defensible estimate of the maximum demand for biomass-based diesel (BBD) for 2023, 2024, and 2025. We can do this because we know mandates are and will be binding. Image
3. I will leave the details of the computations to the article. Suffice it to say that under the EPA's preliminary rulemaking, the max amount of BBD needed is about 4BG each year. That is national demand for sum of RD and BD. Image
Read 11 tweets

Did Thread Reader help you today?

Support us! We are indie developers!


This site is made by just two indie developers on a laptop doing marketing, support and development! Read more about the story.

Become a Premium Member ($3/month or $30/year) and get exclusive features!

Become Premium

Don't want to be a Premium member but still want to support us?

Make a small donation by buying us coffee ($5) or help with server cost ($10)

Donate via Paypal

Or Donate anonymously using crypto!

Ethereum

0xfe58350B80634f60Fa6Dc149a72b4DFbc17D341E copy

Bitcoin

3ATGMxNzCUFzxpMCHL5sWSt4DVtS8UqXpi copy

Thank you for your support!

Follow Us!

:(