1/ Covid (@UCSF) Chronicles, Day 126
I usually don’t post on Mondays, but there’s been enough concerns about the numbers that I’ll do a brief update. Bottom line: SF, Bay Area & CA all fairly stable, maybe plateaued. Elsewhere (particularly the southern states): not so good.
I usually don’t post on Mondays, but there’s been enough concerns about the numbers that I’ll do a brief update. Bottom line: SF, Bay Area & CA all fairly stable, maybe plateaued. Elsewhere (particularly the southern states): not so good.
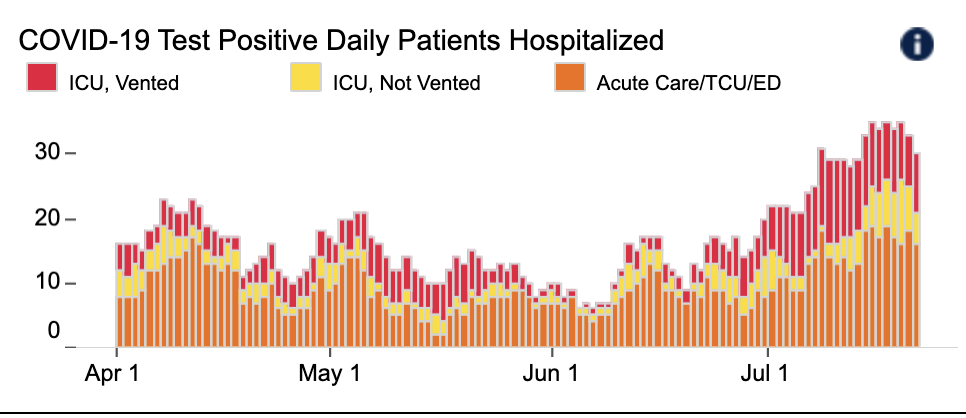
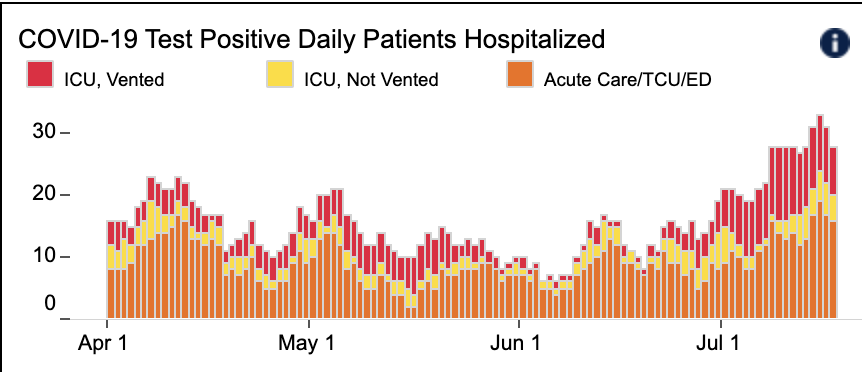
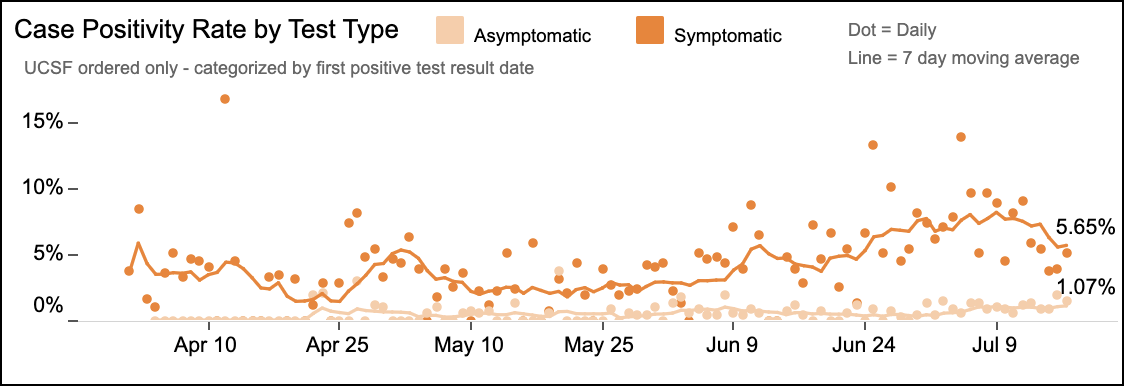
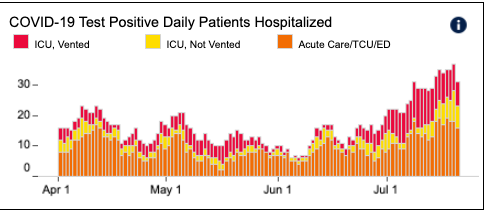
2/ At @UCSFHospitals, 31 pts, 8 on vents. Down from peak of 36 pts over the weekend – too early to declare a trend, but we’d been marching upwards for the prior 2-3 weeks, so hoping it is. Test positivity rate unchanged, overall 2.1%; still about 1% positive in asymptomatic pts. 
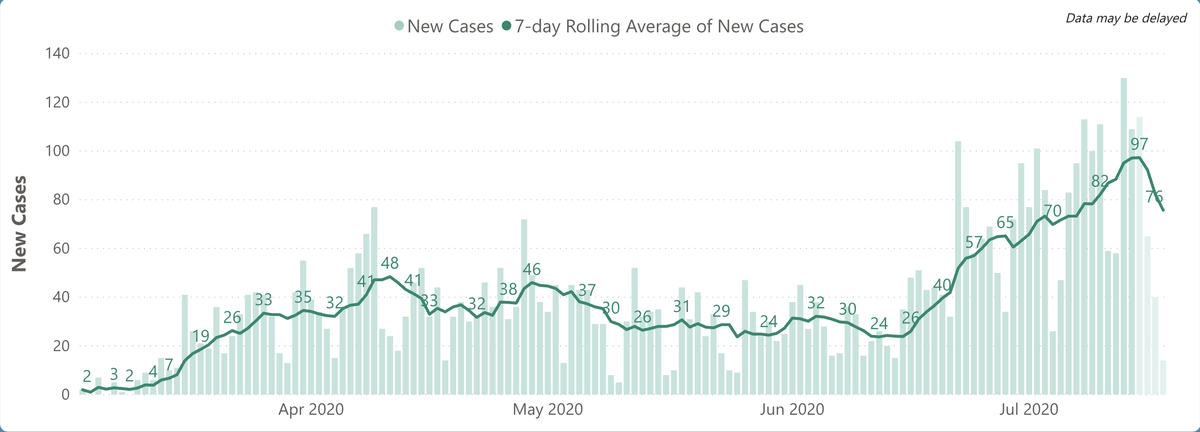
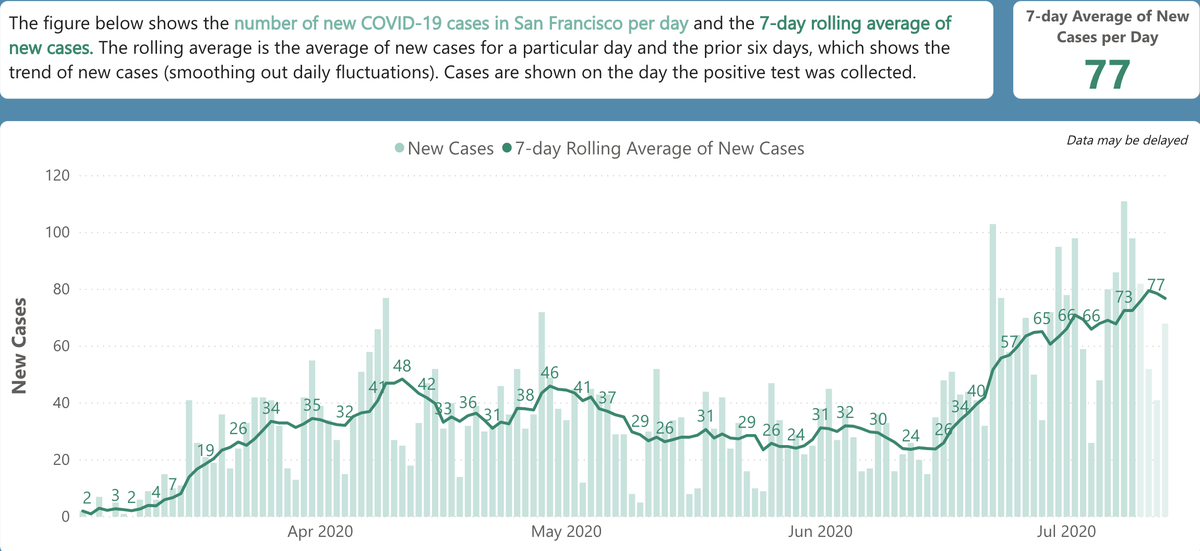
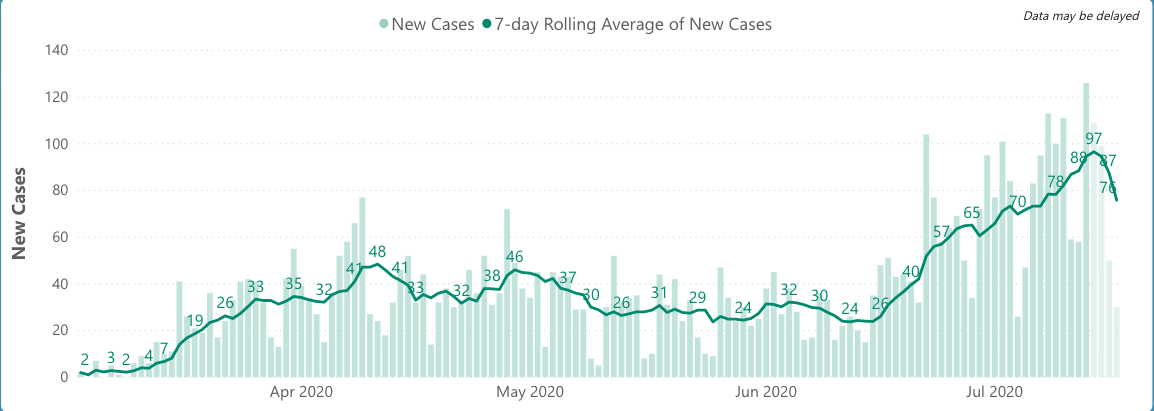
3/ SF also dipping down a bit, with rolling average of 76 new cases per day. Similar to our @UCSF hospital census, this is ~three times the June daily totals, but lower than 80s-90s of last week. Given the shortage of tests, this could be due to less testing – too soon to tell.
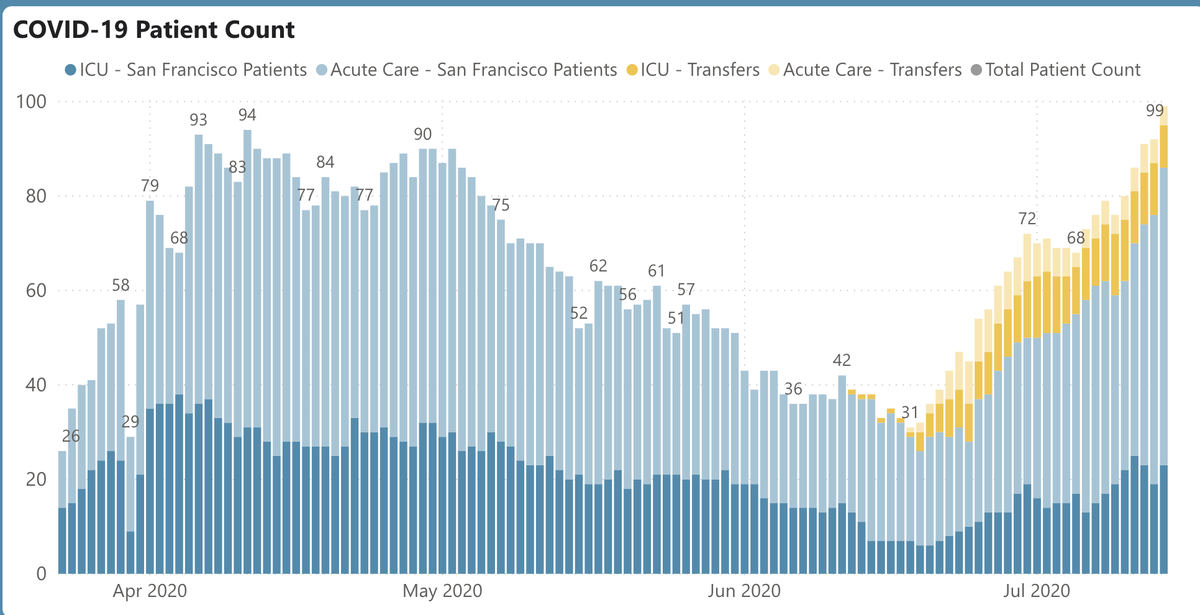
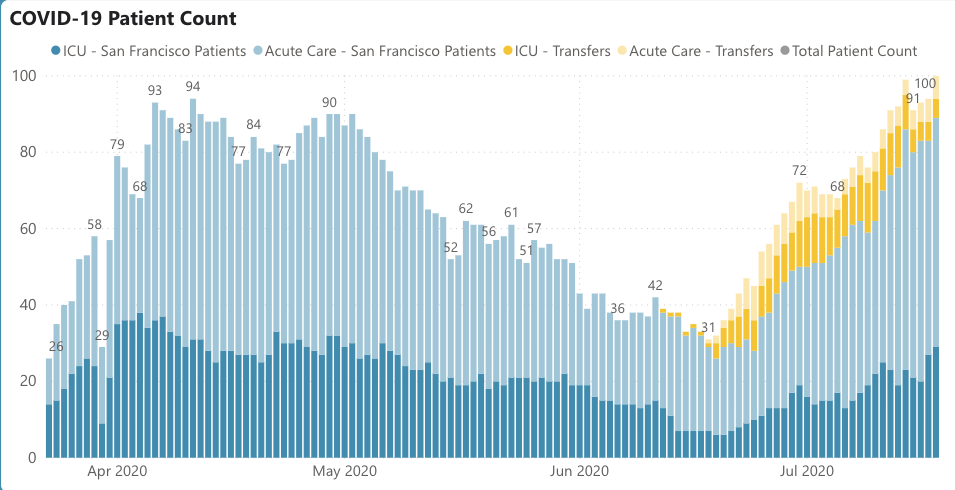
4/ SF hospitalizations hit 100, a first; still not enough to stress capacity, but a worrisome trend. Mostly home-grown: fraction from outside transfers down a bit. ICU fraction not up as much as non-ICU; might be that meds (Remdesivir/steroids) are preventing some deteriorations.
5/ We often talk about the lag between new cases being diagnosed, and new hospitalizations (often a week later) and deaths (often 1-3 weeks after that)….
6/ …But the lag can go the opposite way too: if cases are starting to fall (due to restrictions in early July, plus better behavior), I’d expect to see fall in new cases first, with fall in hospitalizations lagging behind, since it takes a while for people to recover and leave.
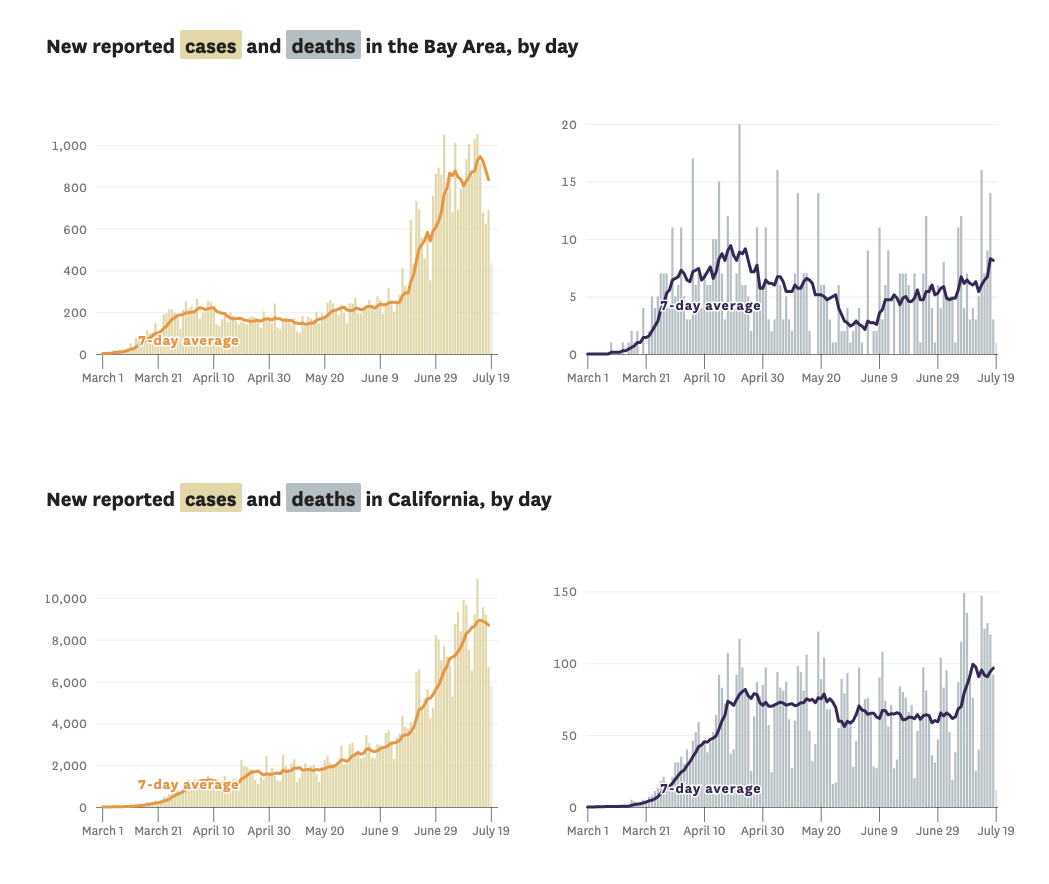
7/ Reassuringly, Bay Area cases also down a bit, as are CA cases. But deaths mildly up – might be the same reverse lag: once people are sick enough to be in the hospital and ICU, their outcome has nothing to do with new cases; instead deaths reflect what happened several wks ago.
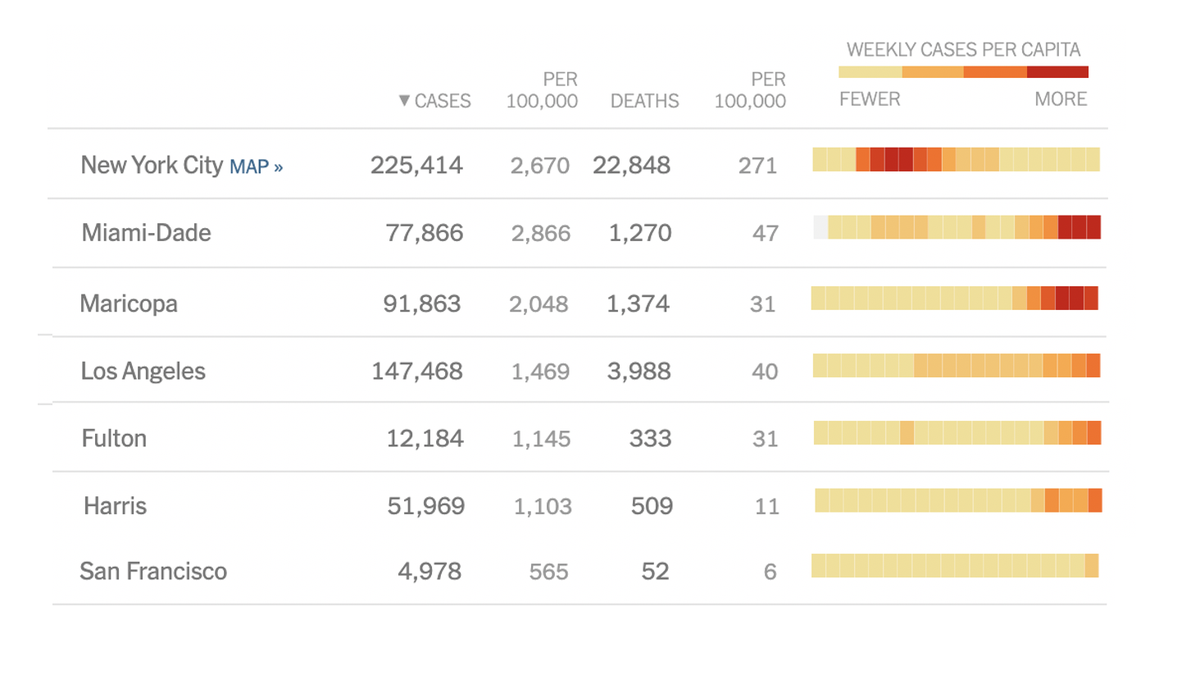
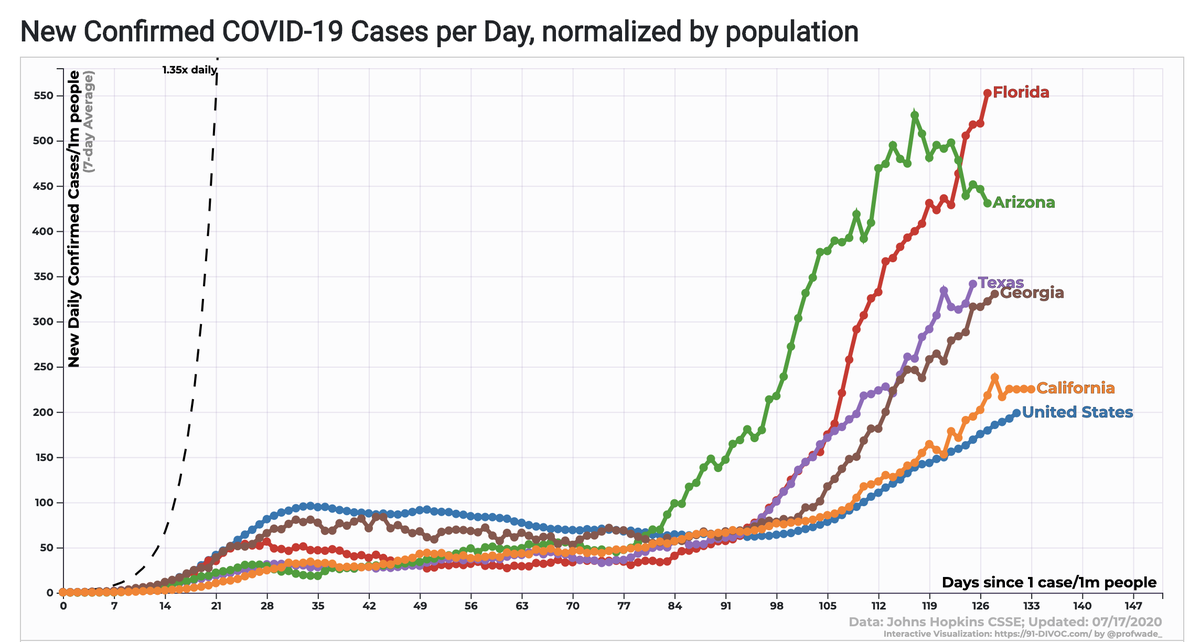
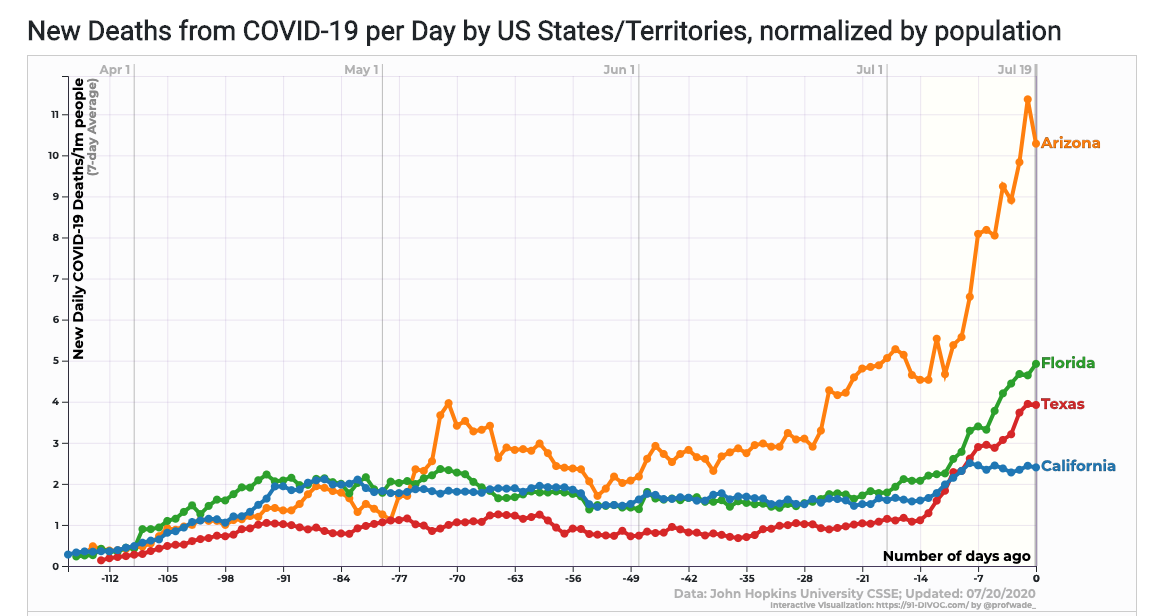
8/ Looking to the U.S., CA cases (by populatn) stable. AZ trending down from sky-high peak. TX may also be plateauing, at nearly 2x CA’s level. GA/FL continue their upward climbs – Florida to crazy-high levels. My 90 & 84-yo parents are basically in solitary confinement in Boca.

9/ Even though AZ has fewer cases, deaths still rising (maybe a little downturn now), again based on cases caught a few wks ago. FL & TX deaths heading up. Looking at case curve, can expect deaths to continue to rise for another wk or more. CA had a small bump and has plateaued.
10/ Some other nice graphs from my favorite Covid data-viz site, 91-DIVOC.com tinyurl.com/u4fgp5v. Here, I’ve left CA on the graph but add the raw cases/day by U.S. region. Most of the growth is from the South; now more than 2x of the Northeast at its April peak.
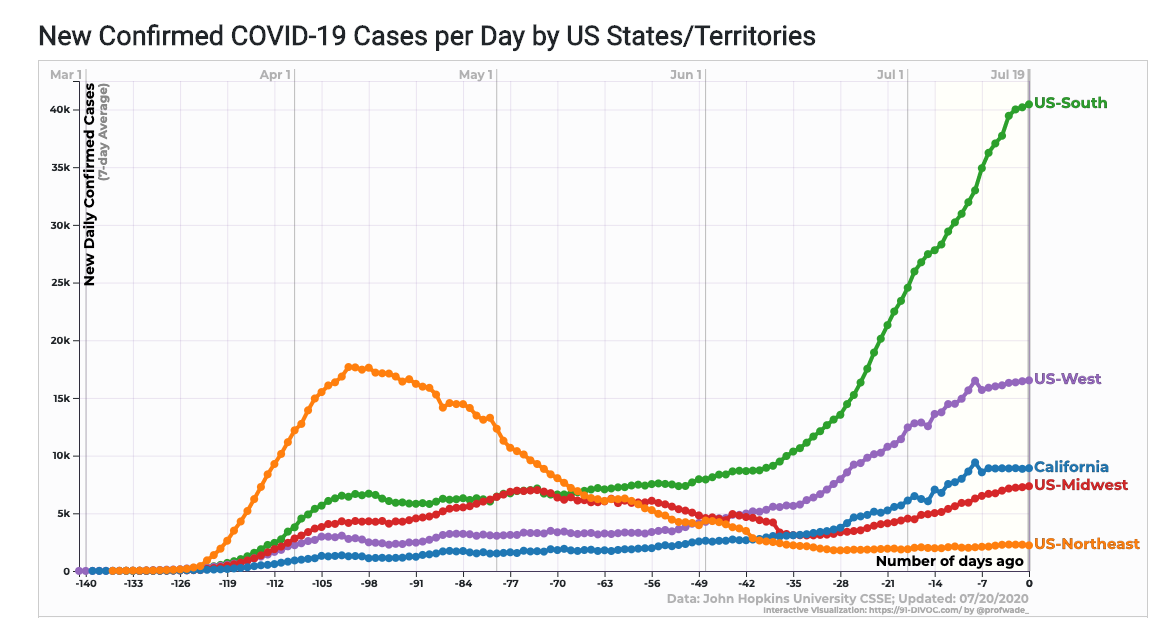
11/ The West is growing too, about half coming from CA. But West's growth is fraction of the South's. The Midwest is on an upward slant as well, not at the height of the West, but nearly matching West's trajectory. Northeast remains blissfully calm, but hopefully not complacent.
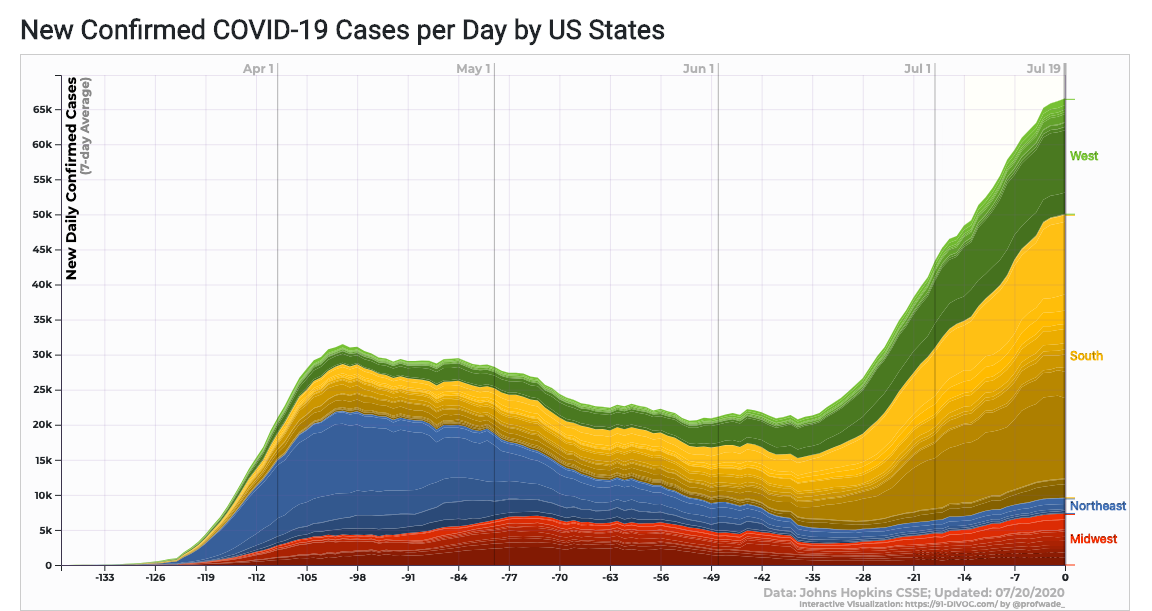
12/ Here’s the same data shown another way, highlighting the proportion of the case-load contributed by various regions. This graph vividly shows how much of the overall U.S. surge is coming from the southern states.
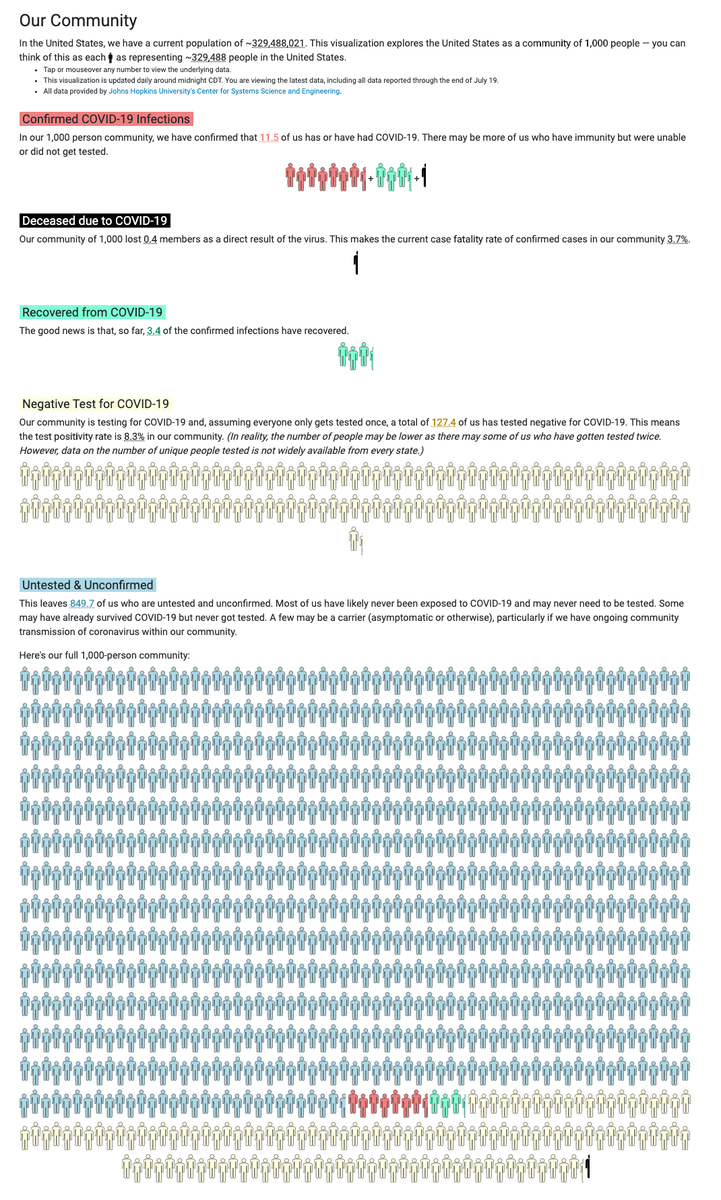
13/ Very cool DIVOC feature: “Our Community” tinyurl.com/yxz5zan6 It depicts Covid status of a region by displaying a slice of 1000 people. Red=cases, black=died of Covid, green=recovered & likely immune, yellow=tested negative, blue=untested & unknown status. Here’s CA…
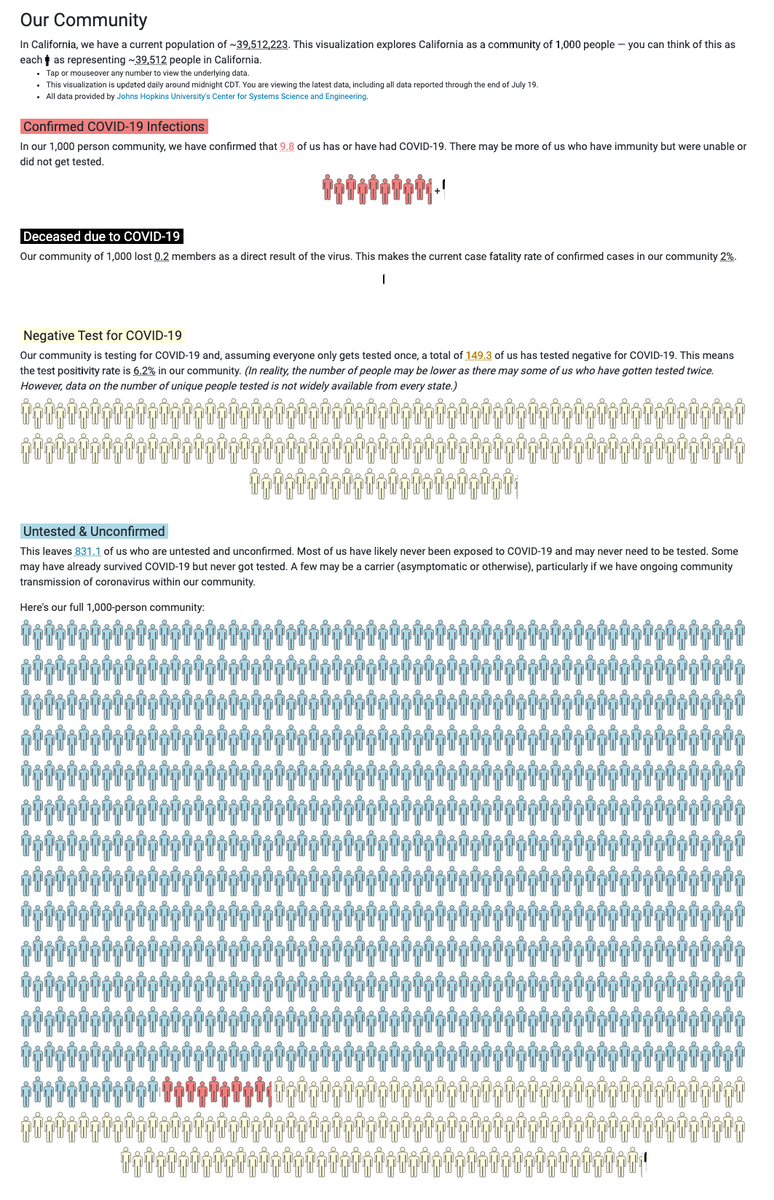
14/ … and here is the U.S. as a whole.
15/ I've predicted that the same stuff (good governance, people mostly following health rules) that led Bay Area & CA to light caseloads in March-May would kick in in July as the end of the "CA Miracle" became clear. That seems to be happening, tho too early to declare victory.
16/ Unfortunately, this flattening isn’t happening as quickly across the South, which will lead to preventable deaths for thousands of people. Whether this is bad leadership, bad follower-ship, or both: who knows? The virus doesn’t care.
17/ I continue to be awed by the number of terrific and freely available data visualization sites that help one understand the dynamics of the pandemic. None of them existed 4 months ago. Kudos to the developers. And nice to have one area of Covid in which we’ve done very well.
18/ I’m starting on clinical service so will post my weekly thread tomorrow rather than Friday. My topic: When are we going to be able to truly return to “normal?” It's anybody’s guess, really, but I’ll give you mine.
19/ Then I'll be back on Thursday for Grand Rounds. This week, we’ll have reports from hospitals in surging cities: Miami, Atlanta, & Houston, along with an update on what’s happening inside @UCSFHospitals.
See you tomorrow, stay safe.
See you tomorrow, stay safe.