1/n
Yesterday @teri released a new report on the grid integration of wind and solar in India.
This thread summarizes some of the findings, but there is a lot more available in the report and results data, which is freely available for download (links at the end of this thread!)
Yesterday @teri released a new report on the grid integration of wind and solar in India.
This thread summarizes some of the findings, but there is a lot more available in the report and results data, which is freely available for download (links at the end of this thread!)
2/n
We used a unit commitment and dispatch model to study the operation of the power system:
- all generating units in India
- 8760 hours of the year (and 15 min blocks for some periods).
- all states with unique demand and supply profiles
- 7 unique scenarios & 4 sensitivities
We used a unit commitment and dispatch model to study the operation of the power system:
- all generating units in India
- 8760 hours of the year (and 15 min blocks for some periods).
- all states with unique demand and supply profiles
- 7 unique scenarios & 4 sensitivities
3/n
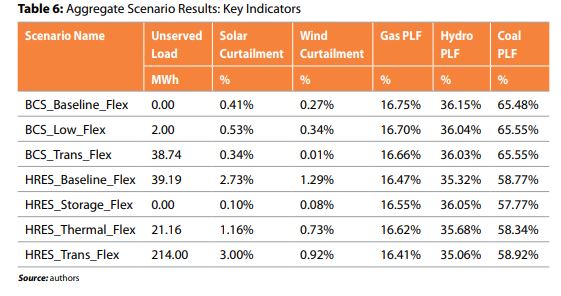
In all scenarios, the model could meet demand with negligible levels of unserved load, and acceptable levels of curtailment.👇
Wind and solar curtailment peaked at 4% in the High Renewables Scenario, without additional flexibility measures.
In all scenarios, the model could meet demand with negligible levels of unserved load, and acceptable levels of curtailment.👇
Wind and solar curtailment peaked at 4% in the High Renewables Scenario, without additional flexibility measures.
4/n
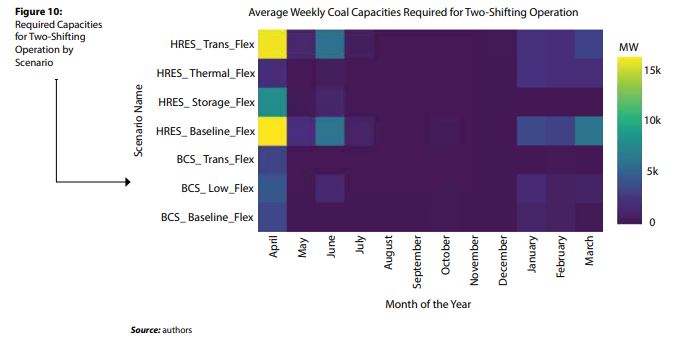
Existing hydro and coal provide supply-side flexibility. The aggregate coal PLF is 57-65% depending on the scenario, but it shifts from baseload to load following.
In some scenarios the coal fleet has to be aggressively cycled, incl 16 GW on two-shifting operations 👇
Existing hydro and coal provide supply-side flexibility. The aggregate coal PLF is 57-65% depending on the scenario, but it shifts from baseload to load following.
In some scenarios the coal fleet has to be aggressively cycled, incl 16 GW on two-shifting operations 👇
5/n
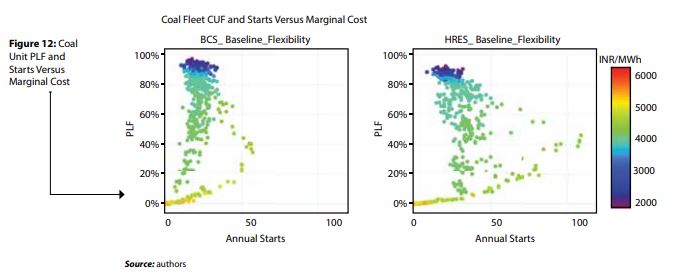
A part of the coal fleet never starts even in scenarios that rely most heavily on coal as a balancing resource.
These are older, high marginal cost plants, with high heat rates and transport costs. The results show these can be closed w/o compromising security of supply.👇
A part of the coal fleet never starts even in scenarios that rely most heavily on coal as a balancing resource.
These are older, high marginal cost plants, with high heat rates and transport costs. The results show these can be closed w/o compromising security of supply.👇
6/n
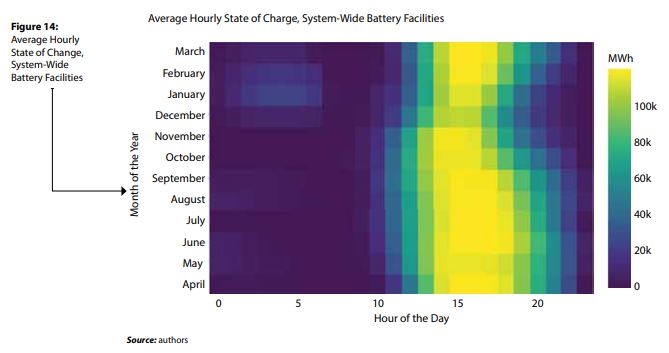
Although scenarios w/o storage can also integrate wind and solar, storage provides several benefits: reduced curtailment, reduced coal fleet cycling and starts, and lower dispatch of high marginal cost plant.
Storage charges at high solar hours, and supports evening peak.👇
Although scenarios w/o storage can also integrate wind and solar, storage provides several benefits: reduced curtailment, reduced coal fleet cycling and starts, and lower dispatch of high marginal cost plant.
Storage charges at high solar hours, and supports evening peak.👇
7/n
A major benefit is reduced coal fleet starts, seen 👇 which shows April operations for the 20 most aggressively cycled units in the High Renewables Scenario with and without Storage.
In the scenario with storage, starts and stops are reduced, as is ramping.
A major benefit is reduced coal fleet starts, seen 👇 which shows April operations for the 20 most aggressively cycled units in the High Renewables Scenario with and without Storage.
In the scenario with storage, starts and stops are reduced, as is ramping.

8/n
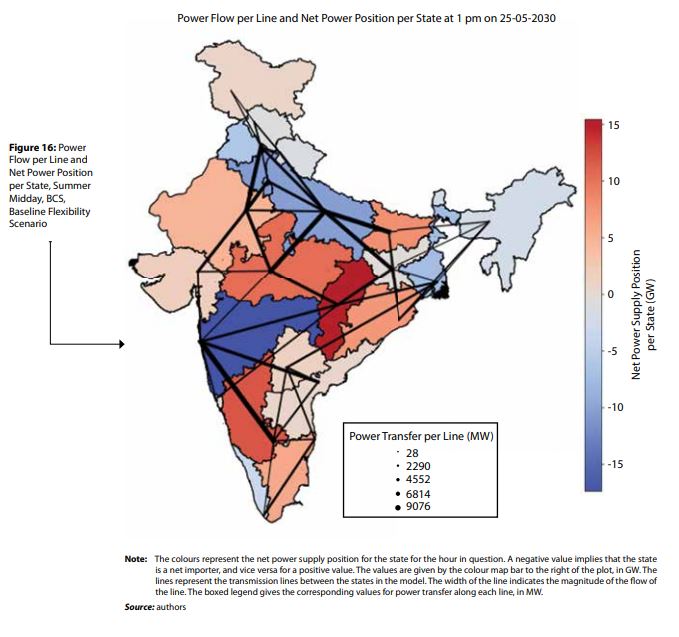
The transmission system provides substantial flexibility. On the highest RE injection hour, ~40% of power consumed crosses a state border.
Power flows vary in magnitude and direction depending on season and time of day; coordinating these flows is a major challenge ahead.
The transmission system provides substantial flexibility. On the highest RE injection hour, ~40% of power consumed crosses a state border.
Power flows vary in magnitude and direction depending on season and time of day; coordinating these flows is a major challenge ahead.
9/n
33% wind and solar in total generation, 47% zero c with large hydro and nukes, can be integrated at no extra system cost 👇. The higher fixed cost of the High Renewable Energy scenario is compensated by lower variable cost.
Total zero c capacity is 66%, way above the NDC.
33% wind and solar in total generation, 47% zero c with large hydro and nukes, can be integrated at no extra system cost 👇. The higher fixed cost of the High Renewable Energy scenario is compensated by lower variable cost.
Total zero c capacity is 66%, way above the NDC.

10/n
Report available here: teriin.org/sites/default/…
All results free for visualization & download here: teriin.org/etctool/
Big congrats to my co-authors: @Raghavpachouri, @shubh0411, @Neshwin13 , Renjith.
Big thanks @nworbmot who wrote the original model.
#Freethemodels
Report available here: teriin.org/sites/default/…
All results free for visualization & download here: teriin.org/etctool/
Big congrats to my co-authors: @Raghavpachouri, @shubh0411, @Neshwin13 , Renjith.
Big thanks @nworbmot who wrote the original model.
#Freethemodels
• • •
Missing some Tweet in this thread? You can try to
force a refresh


