Thomas Spencer Profile picture
Analyst @IEA. Interested in environment, politics, and economics. Give me a good book and I am happy. All tweets my own views, retweets not endorsements
Herve Moal Profile picture 1 subscribed
Mar 1 7 tweets 3 min read
Today we published our estimate of CO2 emissions in 2023. The bad news is that they rose again, by 1.1%.

The good news is that there are lots of causes for optimism if you look underneath the headline numbers.

A quick 🧵

iea.org/reports/co2-em… Clean energy technologies grew strongly in 2023. Solar PV, driven by China, grew 420 GW and wind around 120 GW.

That's another ~550 TWh of clean electricity coming online this year (a lot of this capacity came online at the end of 2023, and will only be felt fully in 2024) Image
Nov 15, 2022 9 tweets 4 min read
1/n
Today the @IEA released a special report on the role of coal in net zero transitions. With this thread I want to highlight some of the key findings of the report.
Thread
iea.org/news/achieving… 2/n
Firstly, energy transitions are not and cannot be just about coal. In the central scenario in our report, advanced economies act strongly this decade already on emissions from oil and gas, as well as coal.
Dec 28, 2021 10 tweets 3 min read
1/10
Back in India, back reading about India.
It's time for another 10 tweet review.

Book: Whole Numbers and Half Truths: What Data Can and Cannot Tell Us About Modern India

Author: Rukmini S. @Rukmini 2/10
Firstly, this book gets an A-plus for the pun (visual and titular) that you get right from the cover.

@Rukmini is a data journalist from Chennai, one of the field's Indian pioneers and a leading voice in interpreting India's covid experience.
Feb 23, 2021 8 tweets 3 min read
1/n Today we published a model-based assessment of the grid integration costs of VRE.
Note: we only look at profile and balancing costs, not network costs.
Here I summarize the results in 6 easy tweets. 2/n
In all scenarios we study, a short-term 'optimal' level of VRE is substantially higher than current levels, in the order of 40% of total generation.
This is robust to assumptions on demand, storage cost, cost of capital, retirement of end of life assets, etc.
Jan 4, 2021 9 tweets 2 min read
1/n
We ended 2020 with the news that India's power demand cross 180 GW for the first time. Unusually, this occurred in December, when power demand usually peaks is in summer?

What is going on here? Is it sign of the economic recovery?

Short thread. 2/n
Firstly, as I have been repeating, we need to look carefully at both base effect and time period when looking at demand growth.

Monthly demand smooths out daily fluctuations, and comparing 2020 against both 2019 and 2018 shows the importance of the base effect. 👇 Image
Dec 21, 2020 12 tweets 4 min read
1/n
Last week TERI released its flagship report on the prospects for H2 in India.

The full report is here. bit.ly/3poYA2n

At 140 pages, I can't summarize the whole thing in a single thread, but I can do a series of threads.

Today's: H2 in the Indian power sector. 2/n
We do a bottom up assessment to 2050 of power demand across all sectors, including direct and indirect electrification (for electrolytic H2 production).

In the low carbon scenario, power demand reaches as much as 6200 TWh by 2050, with almost 1000 TWh of that for H2. 👇
Sep 30, 2020 15 tweets 6 min read
1/n
In today's thread, I want to take a look at India's NDC target of reducing the GHG intensity of GDP by 33-35% by 2030, compared to 2005.

I argue that this target is essentially BAU, because India's GHG intensity of GDP is declining as a natural part of development.

Thread 2/n
If we take a long run view of the GHG intensity of India's economy since 1947, it can be seen that GHG intensity peaked in about 1985 and has been declining ever since.

Why is this?
Sep 23, 2020 15 tweets 3 min read
1/n
Yesterday Xi Jinping announced that China would peak its emissions and work towards net zero emissions by 2060.

What does this mean for India?

A short thread on why India is fundamentally different from China, and how it could respond in its climate diplomacy. 2/n
India is, simply put, a much poorer country than China. Its GDP at PPP is 57% below that of China. But I think this actually understates how far India is behind China.

Another way of looking: India's final energy consumption per capita is 70% below that of China.
Sep 21, 2020 18 tweets 5 min read
1/n
@KanitkarT @tjayaraman
Thank you for clarifying that the source of your claim that developed country patenting in climate mitigation technologies has collapsed from 2009-10 to 2017.

This allowed me to go back and look through the data.

A (long) thread on innovation. 2/n
Firstly, as per your article, I don't think that you can use 2017 as the cut off for the analysis, because as noted in the OECD metadata "figures for the later years may be decreasing because of legal delays for publishing patent information."
Sep 19, 2020 9 tweets 4 min read
@KanitkarT
@tjayaraman
1/8
In my thread on their article in the Hindu, I wrongly concluded that @KanitkarT and @tjayaraman had got India's and world per capita emissions wrong, as I didn't spot that they used tons C not tons CO2.
I've taken that tweet down and I'm sorry. 2/8
In my defense, no units were mentioned only 'emissions', and tons C is an odd unit to use in a newspaper article.

Adding units would have been good.

I think the rest of @KanitkarT responses to me miss the point. I'll respond to that here again.
Sep 15, 2020 10 tweets 3 min read
1/n
Yesterday BP released its 2020 World Energy Outlook, which got a lot of press for saying that global oil demand has already peaked.

In this thread, I want to unpick a little bit what the BP 2020 WEO says about India.

Lots of interesting stuff here. 2/n
The fig below shows primary consumption by fuel in the outlook's three scenarios.
You may be struck by high huge growth of coal in the BAU scenario (1.8 x between 2018 and 2050). I'll come back to this.
But more striking to me is the modest oil demand growth in the BAU. Image
Sep 11, 2020 6 tweets 2 min read
1/6
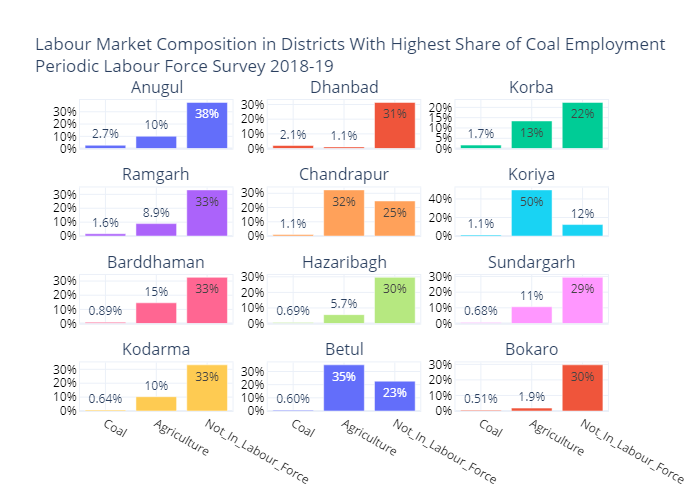
Does India have a problem with 'just transition' of coal mining workers?
I spent some time today looking through the micro-data of the 2018-19 Periodic Labour Force Survey.

Thread. 2/6
In the 12 districts with the highest reported shares of coal mining employment (primary usual status):
1. Agriculture employment was a larger reported employer than coal in all but one.
2. Labour market exclusion was 1-2 orders of magnitude larger than coal employment.
👇 Image
Sep 6, 2020 10 tweets 2 min read
1/10
If it's Sunday night, it must be that I am tweeting about something else than work
Early entry for novel of 2020, candidate to become one of the canonical books about Mumbai, hopefully to replace Suketu Mehta's wildly overrated Maximum City:
Book: "Low"
Author: Jeet Thayil Image 2/10
Dominic Ullis, his last name recalling the original wanderer, Ulysses, takes a flight to Mumbai with nothing but his credit card and the ashes of his dead wife.
What ensues is a tale as absurd as it is profound, as funny as it is sad, as precarious as Mumbai itself.
Sep 2, 2020 10 tweets 2 min read
1/10
I'm sure when I review my top books of 2020, this will be number one in economic history.

An absolutely stunning review of the rise of global capitalism in the pre-war period.

Book: "The Anxious Triumph: A Global History of Capitalism, 1860-1914"
Author: Donald Sassoon Image 2/10
Maybe it's covid, maybe it's the weight of a few extra years, but I've been oddly anxious lately, obsessively watching US politics.

Reading Sassoon's book has been strangely comforting. Anxiety is nothing new: change is the one constant of the capitalist system.
Aug 29, 2020 10 tweets 4 min read
1/n
@kaul_vivek and @amitvarma in their great podcast Econ Central were kind enough to field a question from me in this week's episode, in which I asked whether @amitvarma's (rather liberal) views of the economic role of the state were influenced by his up-bringing in India. 2/n
Until I'm invited on the show, Twitter shall be my right of reply.
Firstly, I meant no disrespect, nor was any taken; I cheerfully submit myself to my own question: living & working for 3 years in India, seeing the role of the state, has moved MY views to the right.
Jul 30, 2020 14 tweets 4 min read
1/n
Last week we also released a report on updated projections of India's electricity demand out to 2025, in the light of the COVID shock.

In this thread, I provide a summary; links to the pdf and free results data come at the end as your carrot for getting through! 2/n
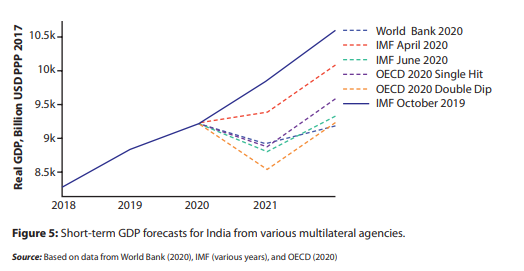
There is now no doubt that India's GDP will contract in 2020. International agency forecasts sit around -3 to -7% 👇. Domestic agencies and banks around -5 to even -9%.

This would be close to if not the worst economic shock in India's post independence history. Image
Jul 22, 2020 10 tweets 5 min read
1/n
Yesterday @teri released a new report on the grid integration of wind and solar in India.
This thread summarizes some of the findings, but there is a lot more available in the report and results data, which is freely available for download (links at the end of this thread!) 2/n
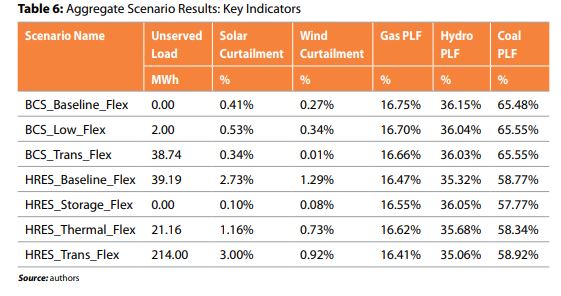
We used a unit commitment and dispatch model to study the operation of the power system:
- all generating units in India
- 8760 hours of the year (and 15 min blocks for some periods).
- all states with unique demand and supply profiles
- 7 unique scenarios & 4 sensitivities
Jul 6, 2020 14 tweets 4 min read
1/n

Today I want to look at how inclusive India's economic growth has been over time, in particular focusing on the structural change of the economy over time.

Has GDP growth occurred in sectors that are employment creating? Or labour sparse and capital intensive? 2/n
The graph below shows the sectoral percentage point contribution to total GVA from 1980 to 1990 (y axis). The width of each green bar represents the sector's share in total employment in the final year. Above the bars I've put sector contribution to total GVA growth. Image
Jun 30, 2020 14 tweets 3 min read
1/n
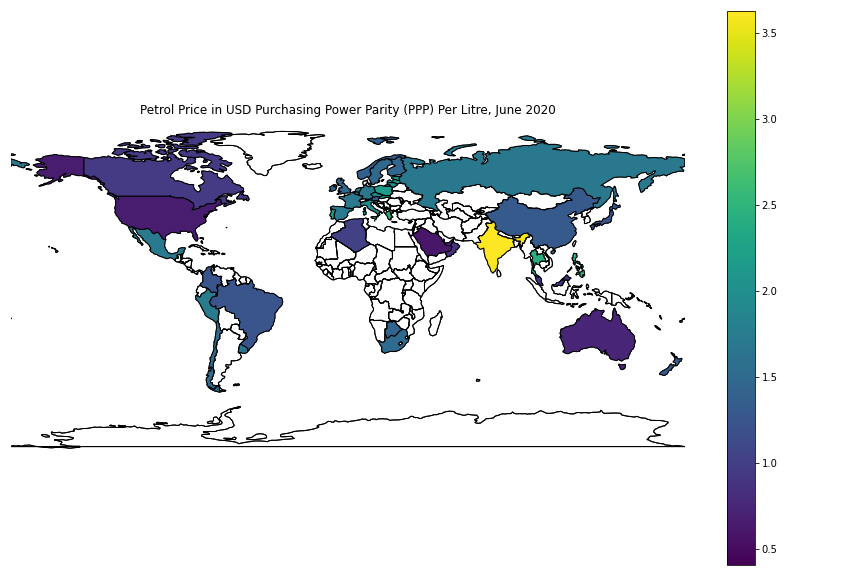
How expensive are petrol and diesel prices in India? Ans: among the highest in the world.

To answer this, we need to use purchasing power parity (PPP) adjusted fuel prices.

The PPP adjustment ensures $1 in one country could purchase the same buddle of goods in another. 2/n
The map below shows the PPP adjusted cost of petrol in 54 countries as of June 2020. The colour scheme represents the values from lowest (Qatar), to highest (you guessed it - India).

Adjusted for domestic affordability, India has the highest fuel prices in the world. Image
Jun 20, 2020 10 tweets 2 min read
1/10
Saturday's 10 tweet review, a cracking book on one of the key economic (and climate change) questions of today: why doesn't the China bubble pop?

Title: "China: The Bubble That Never Pops".
Author: Thomas Orlik Image 2/10
Orlik was the Bloomberg correspondent in China, and Bloomberg Chief Asia Economist. No one seems better placed to understand the ins and outs of China's financial system. Fortunately, Orlik also writes well, and the book is fast-paced, elegantly and energetically written.
Jun 14, 2020 6 tweets 2 min read
1/n

This is the history of the share price of the East India Company (EIC), a privately owned joint stock company which colonized and ruled over India until the British crown took over in 1857. Image 2/n
That spike you can see circled in red is right after the Battle of Plassey, which granted the EIC effective control over Bengal and its rich tax revenues.

What deflated the bubble? The Great Bengal Famine of 1769-1773, in which about 10 million people died.