Thread: MFI Indicator
Created by Gene Quong and Avrum Soudack, MFI stands for Money Flow Index.
#MFI #Indicators #Definedge
Created by Gene Quong and Avrum Soudack, MFI stands for Money Flow Index.
#MFI #Indicators #Definedge
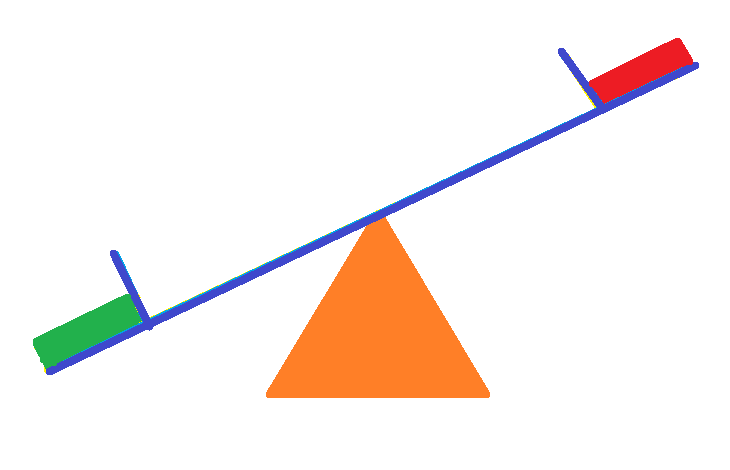
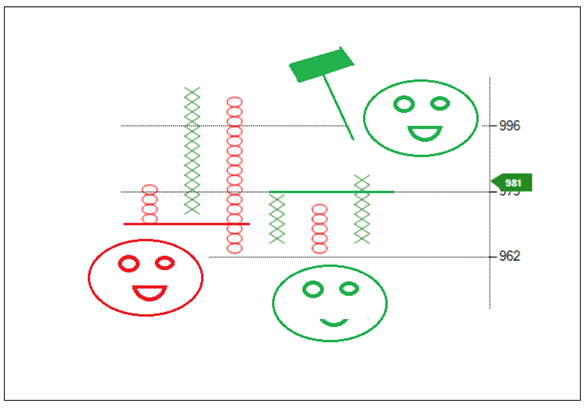
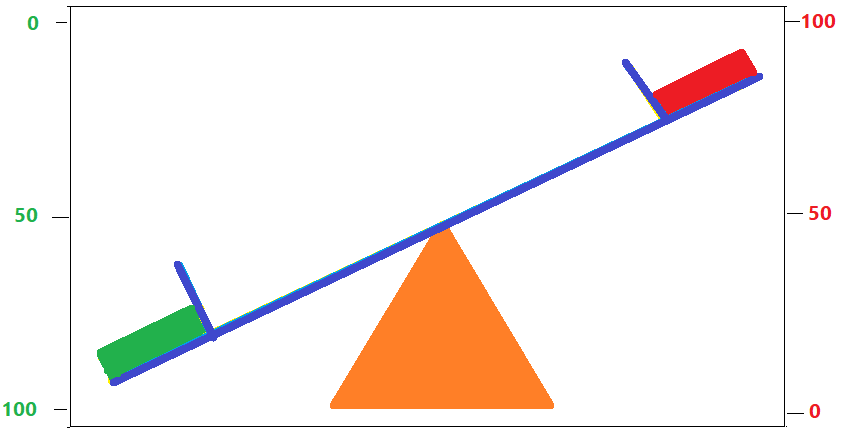
Have you played Seesaw?
Imagine Bulls and Bears are sitting on either side of the seesaw and playing on your screen 😊
Our formula to understand MFI is “PTV on Seesaw”.
Imagine Bulls and Bears are sitting on either side of the seesaw and playing on your screen 😊
Our formula to understand MFI is “PTV on Seesaw”.
If Current price > Previous bar price = Bullish
If Current price < Previous bar price = Bearish
See this chart. There are 10 prices in this session.
There are 5 bullish sessions and 5 bearish sessions.
If Current price < Previous bar price = Bearish
See this chart. There are 10 prices in this session.
There are 5 bullish sessions and 5 bearish sessions.
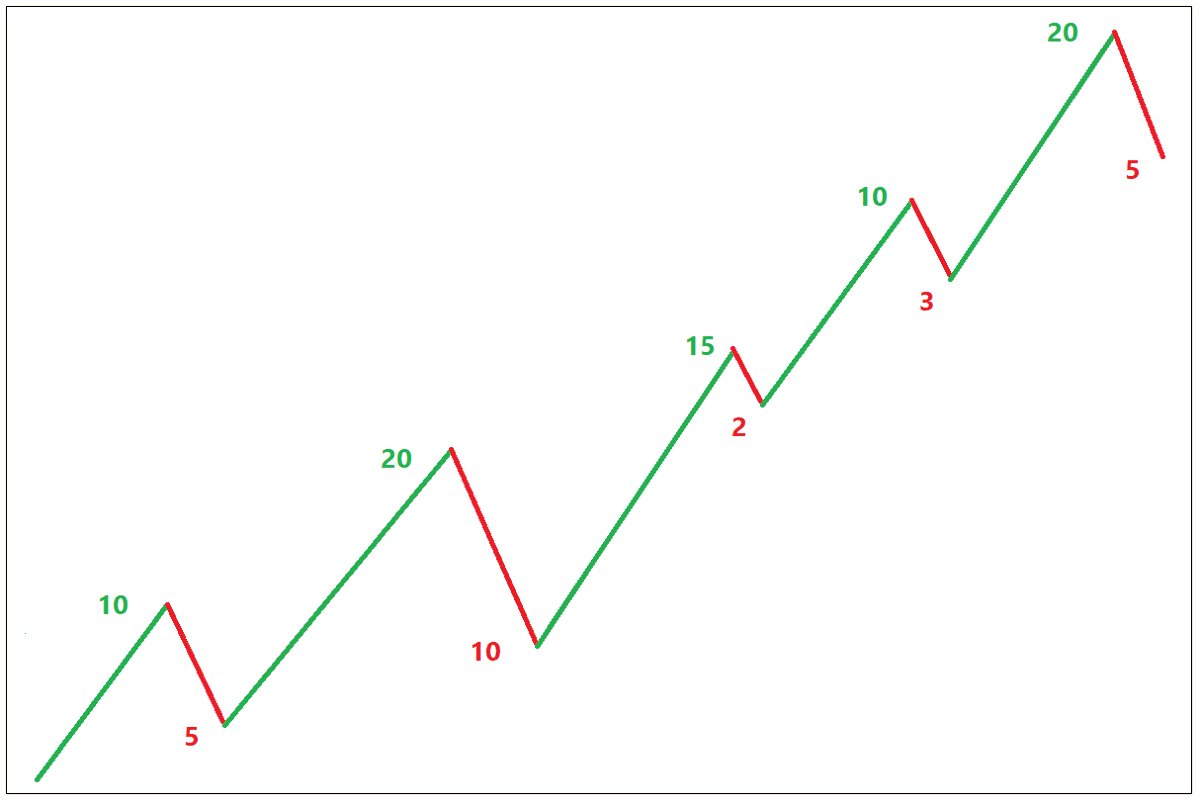
In the example,
Total of Gains is = 75 (10 + 20 + 15 + 10 + 20)
Total of Losses is = 25 (5 + 10 + 2 + 3 + 5)
Total of gains shows us what was the rate of change during bullish sessions and total of losses shows of total rate of change of bearish sessions.
Total of Gains is = 75 (10 + 20 + 15 + 10 + 20)
Total of Losses is = 25 (5 + 10 + 2 + 3 + 5)
Total of gains shows us what was the rate of change during bullish sessions and total of losses shows of total rate of change of bearish sessions.
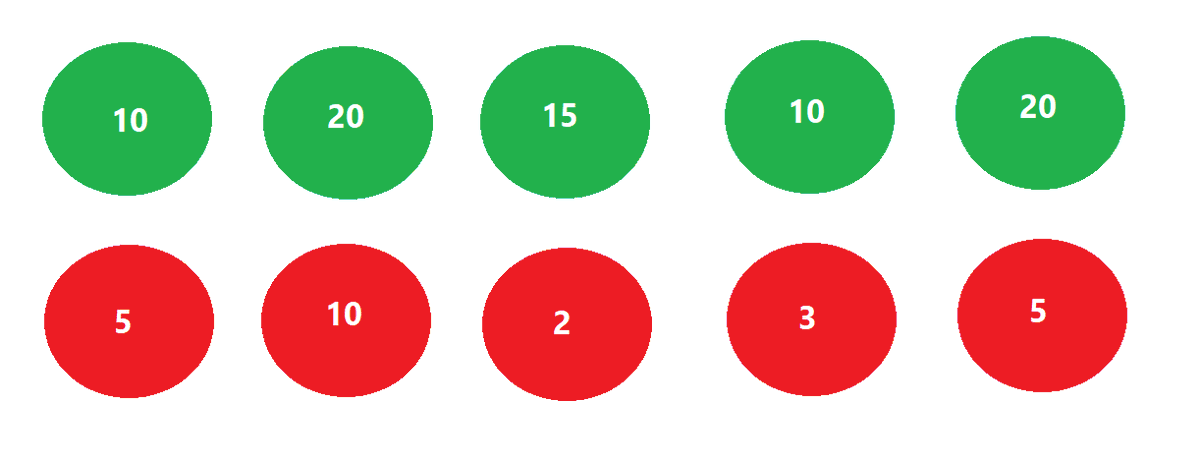
The weight of bulls on the seesaw is 75-points and that of bears is 25-points. So, bulls are strong.
Let us calculate their strength and call it Price Flow Index (PFI):
PFI = Total Gain / (Total Gain + Total Loss)
In above example = 75 / (25 + 75)
Let us calculate their strength and call it Price Flow Index (PFI):
PFI = Total Gain / (Total Gain + Total Loss)
In above example = 75 / (25 + 75)
Did you find this similar to RSI? Difference here is – RSI calculates average instead of sum.
Because of this – the number of sessions chosen does not matter; what matters is the rate of change to calculate the strength.
Because of this – the number of sessions chosen does not matter; what matters is the rate of change to calculate the strength.
For example,
In last 10 sessions:
If the Total gain = 75 (10 + 10 + 20 + 15 + 5 + 10 + 5)
and Total loss = 25 (5 + 10 + 10)
But PFI will be same because total of gains and losses were same. This will not happen if we use method of averaging instead of sum.
In last 10 sessions:
If the Total gain = 75 (10 + 10 + 20 + 15 + 5 + 10 + 5)
and Total loss = 25 (5 + 10 + 10)
But PFI will be same because total of gains and losses were same. This will not happen if we use method of averaging instead of sum.
In the earlier example, there were 5 bullish & 5 bearish sessions. In the second example, there are 7 bullish and 3 bearish sessions. Hope this clears the earlier statement of number of sessions not being relevant.
By the way, the P in “PTV” is PFI.
By the way, the P in “PTV” is PFI.
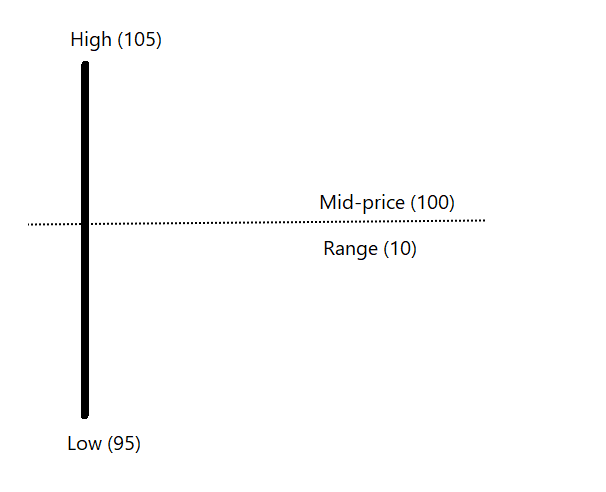
We can also calculate PFI on Typical price instead of closing price. We discussed Typical price while discussing CCI.
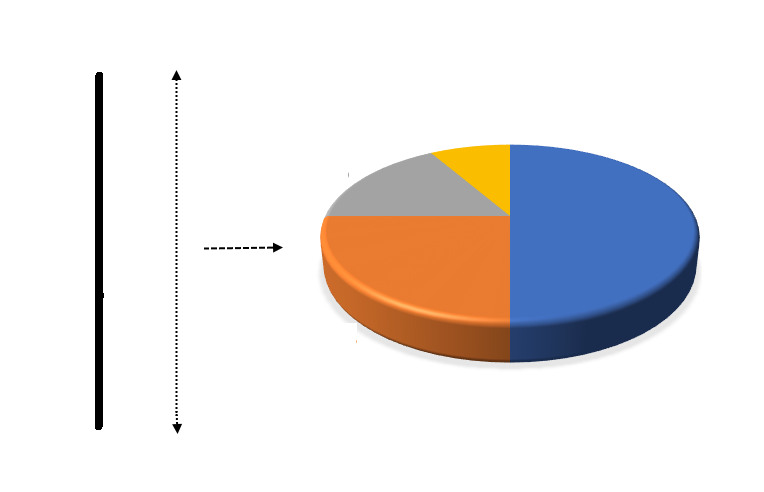
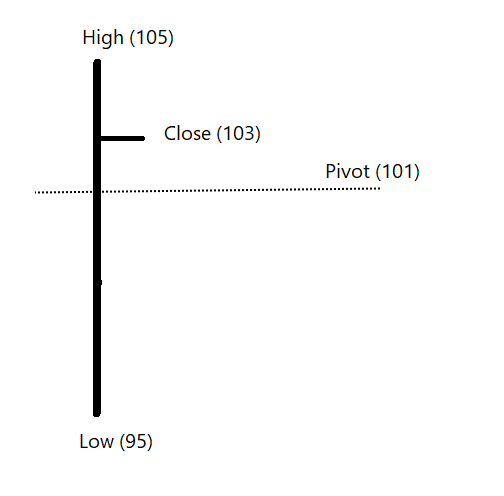
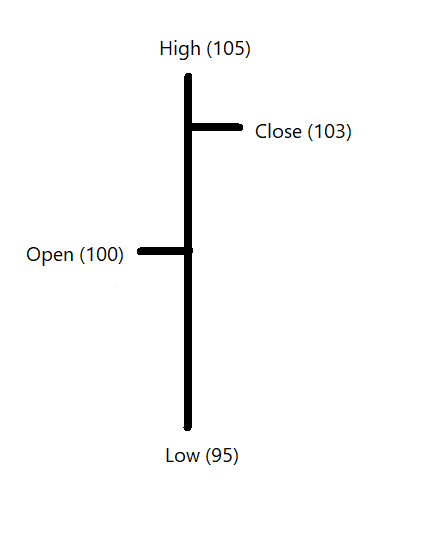
Typical price = (High + Low + Close) / 3
Typical price = (High + Low + Close) / 3
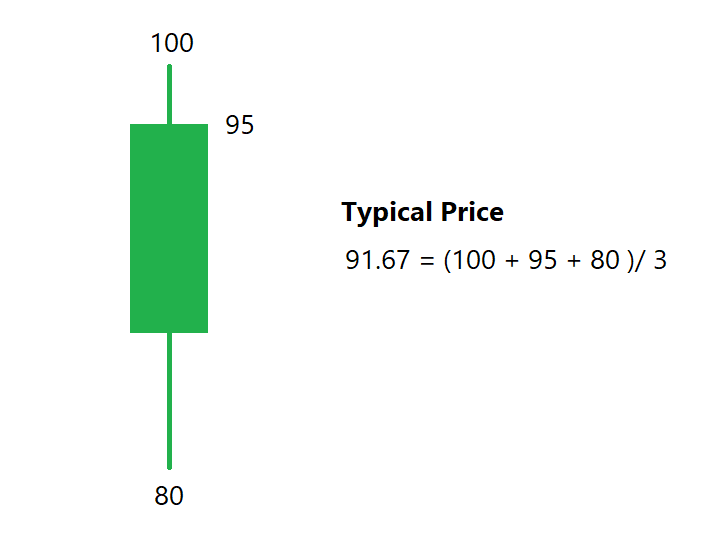
If closing price is exactly at mid-range of candle, Typical price would be equal to closing price. While deciding bullish or bearish, Typical price would check average of three prices in a bar instead of one price.
T in PTV stands for Typical price.
T in PTV stands for Typical price.
Joseph Granville developed Volume indicator called On-Balance Volume (OBV). Philosophy of the indicator is simple:
If price is bullish = Volume of that bar as bullish
If price is bearish = Volume of that bar as bearish
How if we fit same logic for Volume in above calculation?
If price is bullish = Volume of that bar as bullish
If price is bearish = Volume of that bar as bearish
How if we fit same logic for Volume in above calculation?
V is Volume. So, in PFI = Let us multiply price by volume while calculating Gain and Loss of each session
Total Gain is Gain multiplied by Volume of bullish bars, Total of loss is Losses multiplied by volume of bearish bars. Because of Volume PFI becomes MFI - Money Flow Index
Total Gain is Gain multiplied by Volume of bullish bars, Total of loss is Losses multiplied by volume of bearish bars. Because of Volume PFI becomes MFI - Money Flow Index
Have you seen Laurel and Hardy show?
It was a popular comedy American show. Laurel was a lean guy and Hardy was a chubby guy.
It was a popular comedy American show. Laurel was a lean guy and Hardy was a chubby guy.

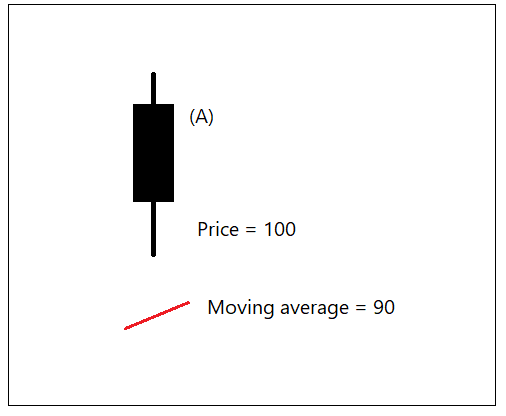
So now in MFI calculation, the price plus volume of each session is considered. If for example,
Price goes up with high volume = Bullish and strong (Hardy - Bullish)
Price goes up with less volume = Bullish but weak (Laurel - Bearish)
Price goes up with high volume = Bullish and strong (Hardy - Bullish)
Price goes up with less volume = Bullish but weak (Laurel - Bearish)
Price goes down with high volume = Bearish and strong (Hardy - Bearish)
Price goes down with less volume = Bearish but weak (Laurel - Bearish)
Price goes down with less volume = Bearish but weak (Laurel - Bearish)
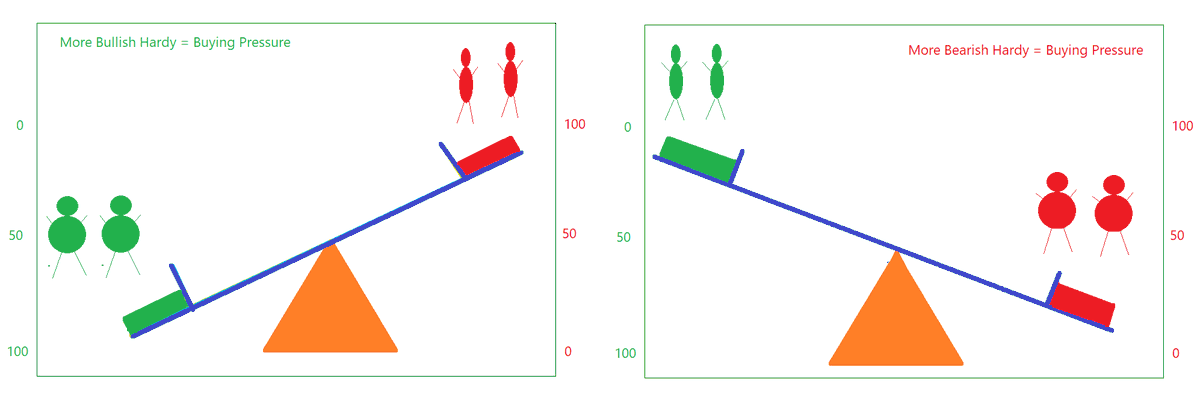
So now, we have Laurel and Hardy for bulls and bears on the seesaw.
Strong sessions with high volume add Hardy to each side. Laurel if volume is not strong.
When Bulls are winning – there is a buying pressure. When bearish are winning – there is a selling pressure.
Strong sessions with high volume add Hardy to each side. Laurel if volume is not strong.
When Bulls are winning – there is a buying pressure. When bearish are winning – there is a selling pressure.
It is known as variation of OBV or volume-weighted RSI. Do you now understand why?
MFI is a momentum indicator which is similar to RSI but it considers Volume also. MFI calculates Sum instead of average like CMO indicator developed by Tushar Chande.
MFI is a momentum indicator which is similar to RSI but it considers Volume also. MFI calculates Sum instead of average like CMO indicator developed by Tushar Chande.
MFI is calculated on Typical price instead of closing price. MFI considers High- Low – Close and Volume in the calculation.
See below chart: 10-period MFI is plotted on the chart. Observe bullish and bearish boxes.
See below chart: 10-period MFI is plotted on the chart. Observe bullish and bearish boxes.
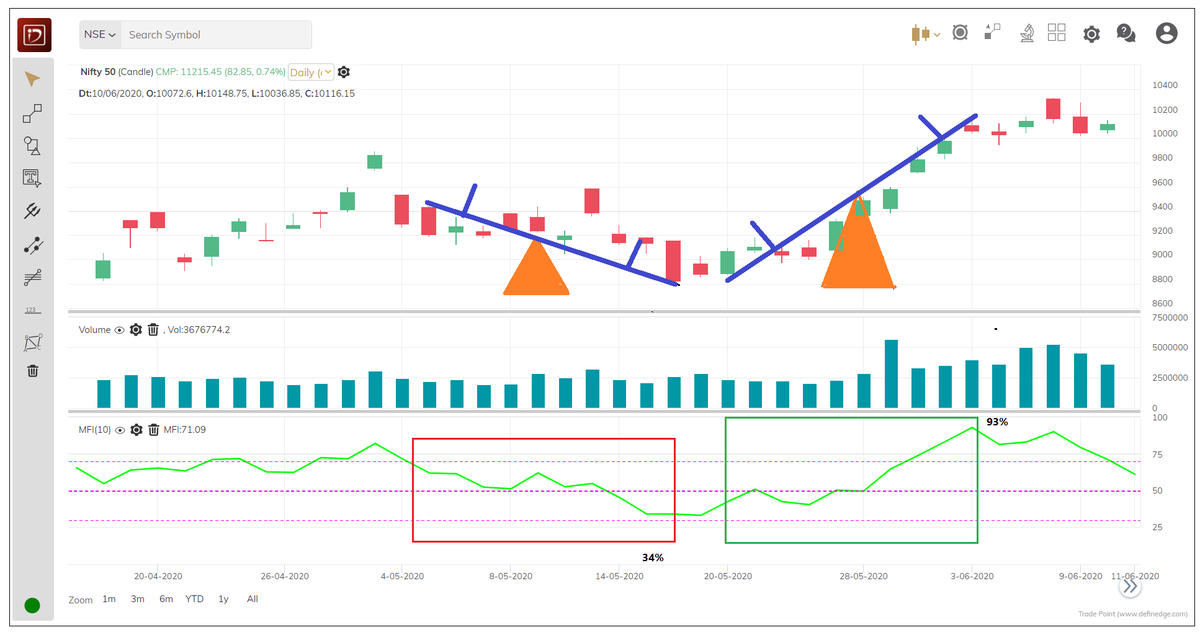
If MFI is above 50, there are more bullish sessions with positive volume. If MFI is below 50, there are more bearish sessions with negative volume. 14 is a widely followed parameter.
When price has more bearish price volume candles, MFI will be lower. In the next bottom, if price there are some bullish volume candles, MFI reading will be higher – that will cause the positive divergence. Remember while reading divergence, MFI is calculated on Typical price.
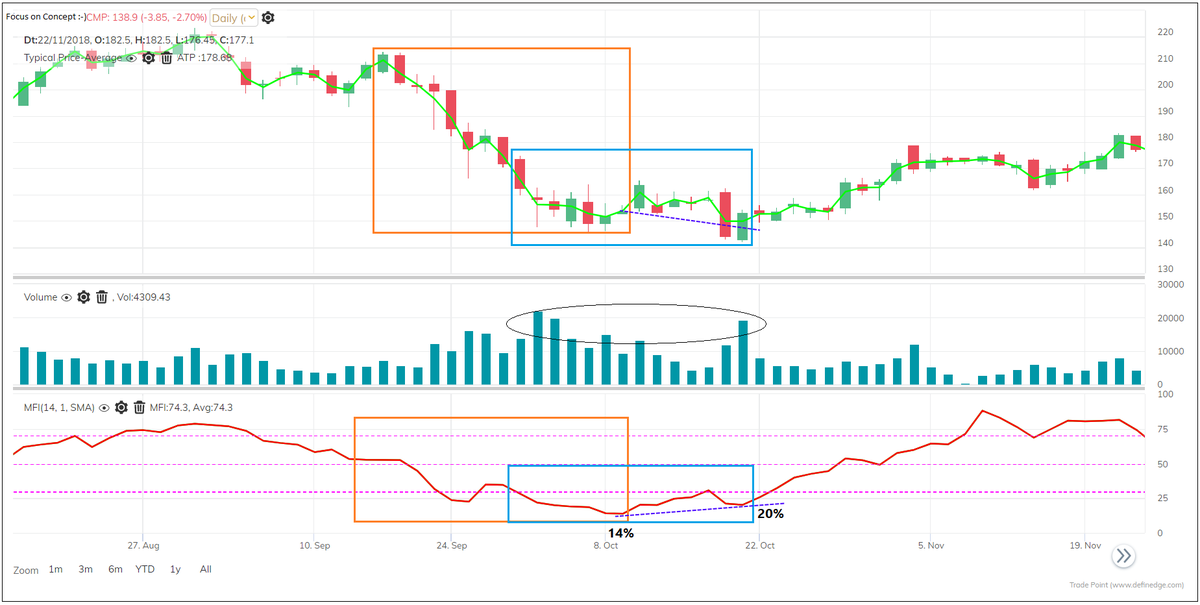
We can also plot average line on MFI to read crossovers. Is 80 overbought - 20 oversold? Think. Pricing moving back from 20 or 80 would mean Hardy appeared on the other side.
If you know the concept well, you will be able to use the tool effectively.
<End of thread>
If you know the concept well, you will be able to use the tool effectively.
<End of thread>
• • •
Missing some Tweet in this thread? You can try to
force a refresh