Prashant Shah Profile picture
CMT, CFTe, MFTA®, MSTA. Author of four books. SEBI Regd RA & IA. Building @definedge
Power Of Compounding 🇮🇳 Profile picture V for Victory Profile picture Anbu chezhian|அன்பு செழியன் Profile picture Bhaskar Bora Profile picture Jitendra Jain Profile picture 82 subscribed
Feb 17, 2023 11 tweets 4 min read
A new way to look at RSI.

RSI is a very popular strength and momentum indicator.

#RSI 14 is a widely followed period for RSI. If you plot 14-period RSI, it calculates a ratio of bullish prices in the last 14 candles.

As a result, a higher RSI indicates a higher ratio of average bullish prices.

Thread on RSI indicator to learn more
Feb 15, 2023 10 tweets 2 min read
In our initiative called Trading Buddy, we planned to meet traders in person.


I had the opportunity to meet 50+ traders in this prog. It was a wonderful discussion, and even I gained a great deal of insight.

Some key points that I observed: (1/10) It was expected that people would begin to discuss the issues. However, the process of opening up took some time.

Jumping to conclusions too quickly is a big problem. More problems result from a lack of problem analysis.
Jan 21, 2023 20 tweets 7 min read
Thread: True Strength Index (TSI) Indicator

A combination of momentum (leading) and smoothing (lagging) qualities.

(1/20)

#Indicator #trading #investing #definedge Image A momentum indicator developed by William Blau, the True Strength Index (TSI) measures a stock's strength.

In general, momentum indicators are aggressive, while smooth indicators are lagging. Both have their advantages & disadvantages.
Aug 11, 2022 23 tweets 8 min read
Thread: Decoding 2-period RSI

#trading 
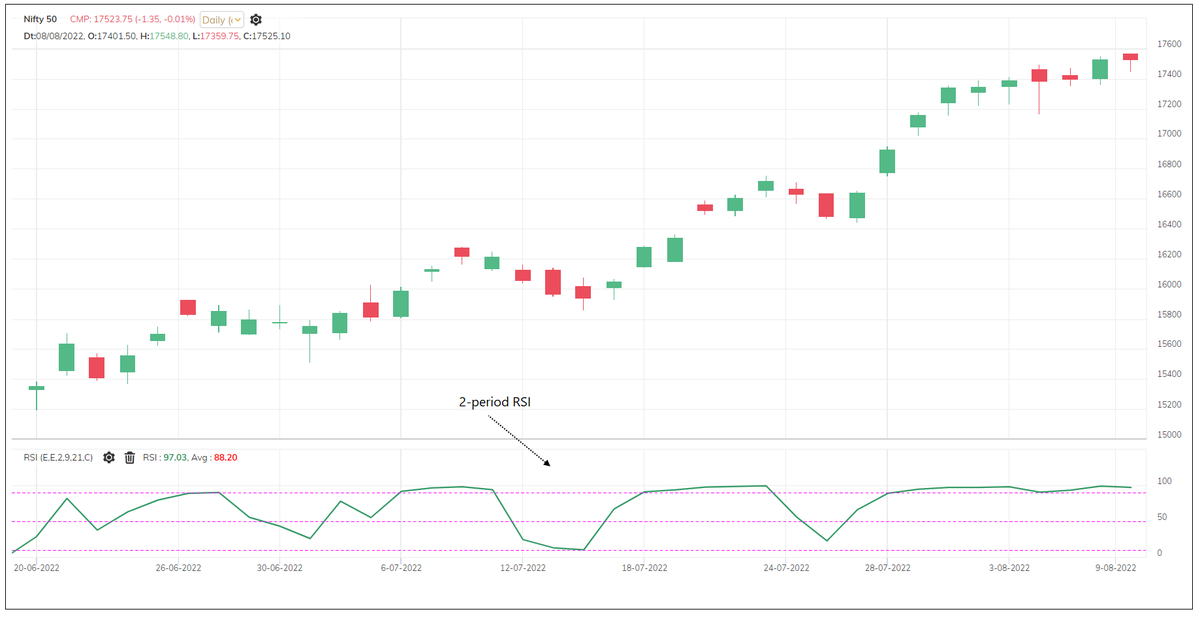
2-period RSI is a popular concept introduced by Larry Connors.

Many traders are using this method in their strategy.

There are two simple rules in the strategy that Larry Connors explained.
Jun 25, 2022 19 tweets 5 min read
Thread: Ulcer Index (UI) – Bears’ indicator, Exit indicator.

Study of and indicator from learning perspective.

Not so known but a useful indicator. The Ulcer Index indicator was developed by Peter Marin and Byron McCann. The indicator was first introduced in their 1989 book, The Investor's Guide to Fidelity Funds.

It was designed to analyse MFs. Ulcer index is known as a volatility indicator but I would not call it that.
Jun 10, 2022 10 tweets 3 min read
Back-testing of some candlestick patterns 🧵

I hv back-tested patterns shown below on 500 stocks (Nifty 500 stock group as on today) since inception on daily timeframe charts.

Below is some interesting information. 
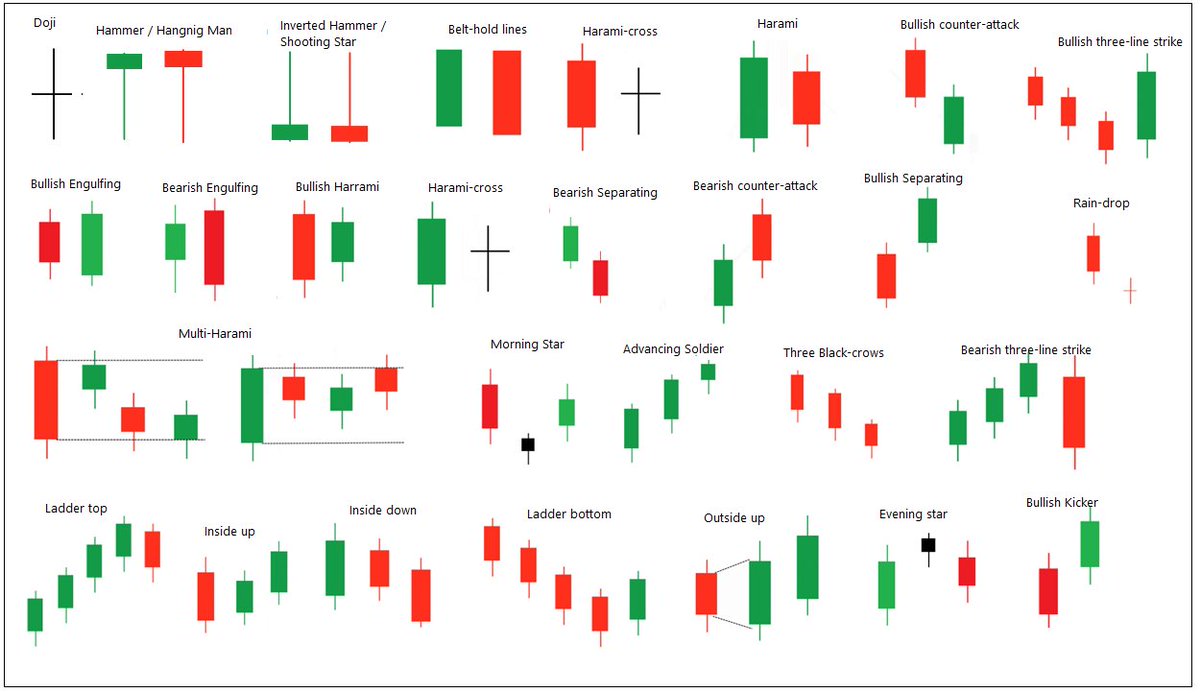
I was doing to design multi-chart setups. But the information in the thread can be useful for people practicing candlestick chart patterns. There are many patterns & we keep coming across more. The data can give you a rough idea about the past performance of patterns.
Jun 9, 2022 16 tweets 5 min read
Thread: 5 Important bullish & bearish chart patterns in technical analysis.

Triangles, Broadenings and Rectangles.

#trading #investing Many traders analyse and practice western chart patterns. There are many such patterns and enough is talked about them in various books and resources.
Long back, I read a book “Encyclopedia of Chart Patterns” by Thomas N. Bukowski. It’s a brilliant work (Must read).
Jan 8, 2022 7 tweets 5 min read
Some continuation and reversal patterns explained with chart examples.

Chart names are not important. Applicable on all instruments and timeframes. (1/7) 1) Image explaining Double-broadening Pattern. Follow-through in such cases offers nice RR trade opportunity
2) Pattern after downtrend on 0.25% box-value. Weakness of bears.
3) Lower shadows on weekly candlestick chart (Demand area)
4) Outperformer of Auto & Infra index
Nov 16, 2021 24 tweets 9 min read
Thread: Camarilla Levels

Continuing our discussion on pivot levels, we look at the Camarilla levels which is another widely followed tool.

Word ‘Camarilla’ is borrowed from Spanish. It translates to a group of confidential & private advisers of the King or person in authority. The Camarilla equation was first developed by a bond trader named Nick Scott in 1989. It is said that he didn't disclose the equation, but people studied the levels & reverse engineered it to find the formula. There r different versions of this formula.
Nov 7, 2021 23 tweets 7 min read
Thread: Central Pivot Range (CPR)

CPR is another popular tool. Three lines are plotted on the chart when we plot CPR.

The three lines are: CPR, TC and BC.

Let’s understand the calculation. You may recall that I explained the calculation of Pivot levels in an earlier thread. CPR stands for Central Pivot Range. It is always a center line of the three lines that gets plotted in the chart.

CPR is a Pivot price. Pivot is average of HLC as explained in the prev thread.
Oct 29, 2021 24 tweets 10 min read
Thread: Pivot levels

Trading based on Pivot levels is one of the popular approaches. Both short-term and intraday traders track Pivot levels to identify support and resistance levels in any instrument.

Let’s discuss how these levels are calculated. 
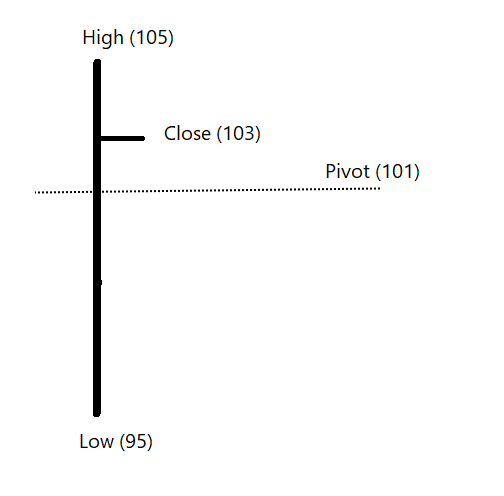
The pivot calculation method considers the previous day prices to calculate the support and resistance levels.
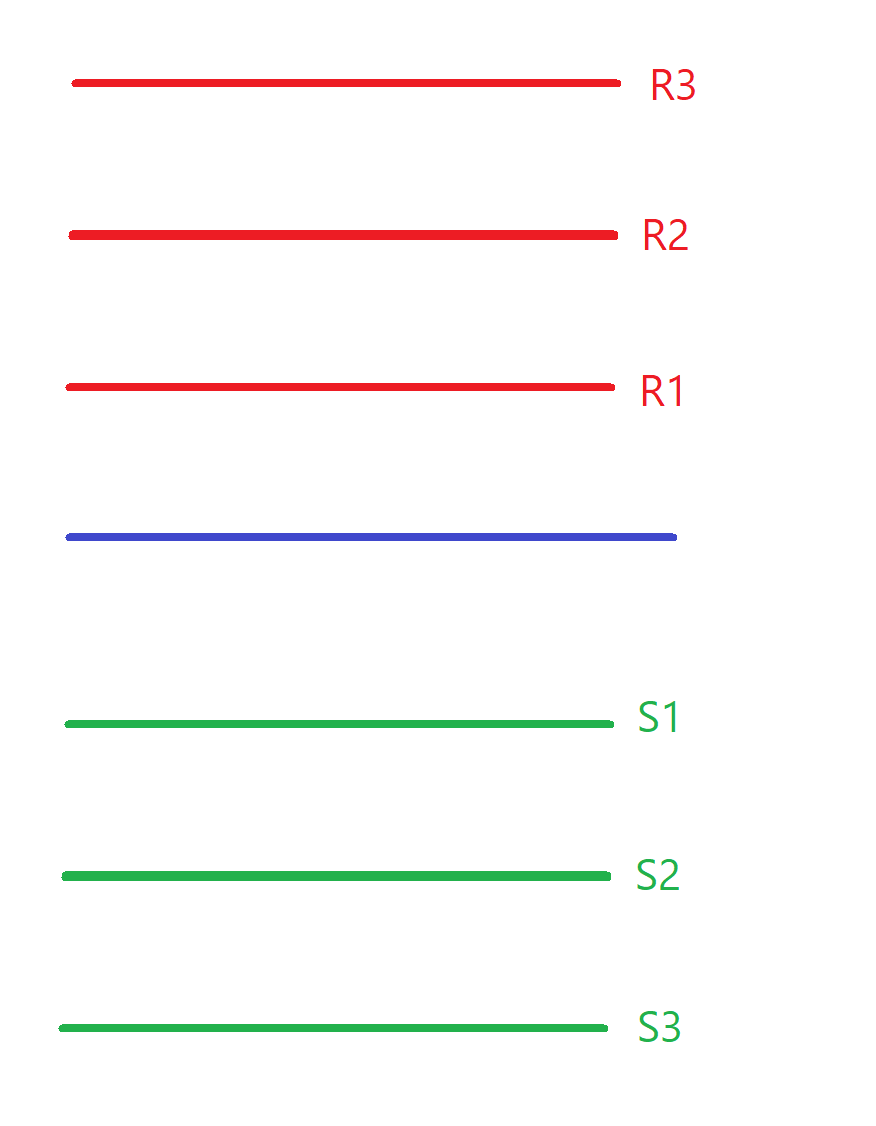
There are seven levels marked on the chart when we plot Pivot as a tool.

There is a Pivot level, 3 support levels (S1, S2 & S3) & 3 resistance levels (R1, R2 & R3).
May 30, 2021 15 tweets 4 min read
Thread: Strike-back Pattern

P&F pattern explained via images. See below image.

Price went below its previous swing low. It is a bearish breakout.
May 21, 2021 18 tweets 6 min read
Thread: Alligator indicator

#Alligator #Indicators #Definedge 
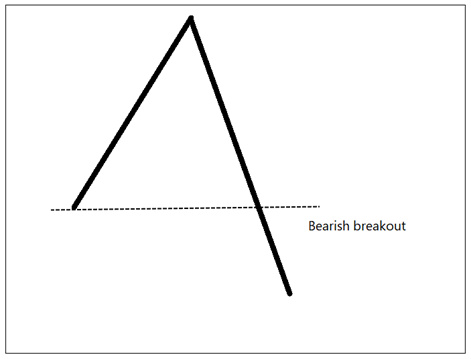
Alligator indicator is created by Bill Williams. He was a popular trader and author.

Before we discuss the indicator, let us understand an important concept.
Apr 11, 2021 17 tweets 6 min read
Last two days were full of learning. Can't thank speakers enough for sharing their years of knowledge and experience candidly in #DECMA2021 .

There were many many takeaways. Thread mentioning some of them: @bluechips4u
Blend of reversal patterns and momentum indicator. Take reference from higher timeframe and plan trades on lower timeframe. Stick to a single timeframe for entry and exit.
Mar 22, 2021 7 tweets 2 min read
Whether trading or Investing, there is a cost you need to bear to follow a strategy.

See point A. Everything was bullish at that point. A trend follower would be bullish at that occasion. It was followed by a strong reversal. 
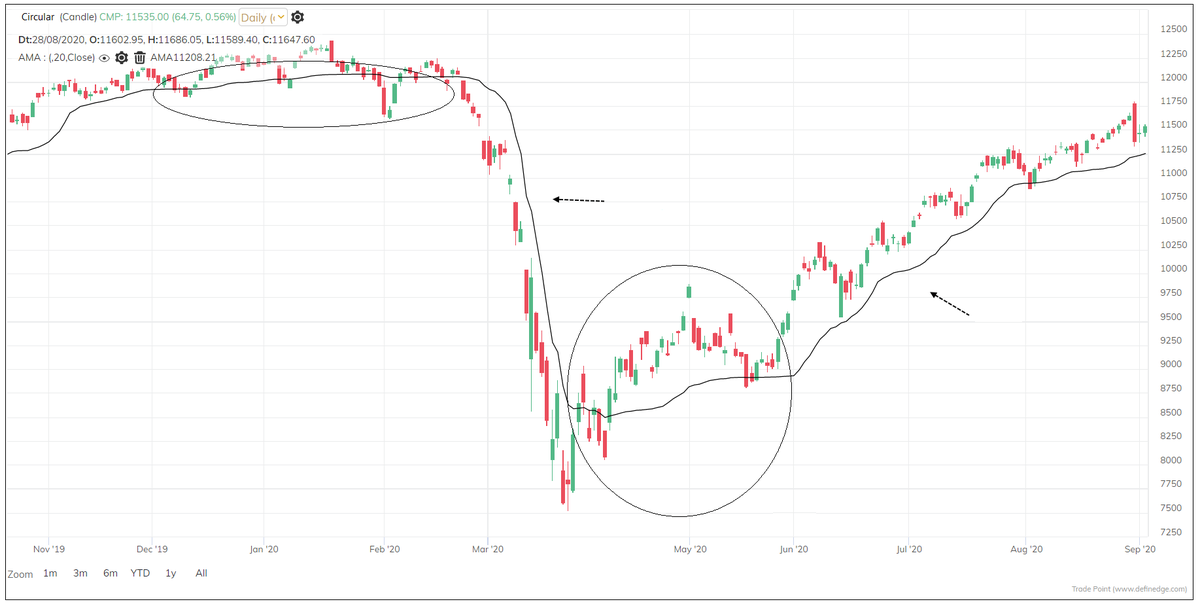
Was it possible to exit before the reversal? Yes, but there will be a cost for it.

If you think there were some indications and signals before reversal - check points B, C, D, E. There were similar signals and many indications there also. Price continued to go up.
Jan 29, 2021 17 tweets 4 min read
Thread: Trade Plan - My thoughts and experience.

You must have heard “Plan your trade and trade your plan”.

#tradeplan #trading #investing #definedge Many experienced traders, authors and analysts keep saying trade as per your plan.

You must write your plan of taking trades and focus on the execution. But you will not see many people really doing that - even many experienced traders.

Possible reasons:
Jan 2, 2021 15 tweets 5 min read
Thread: P&F Super Pattern

An effective price pattern defined using properties of P&F charts.

#Superpattern #Pointandfigure #Definedge 
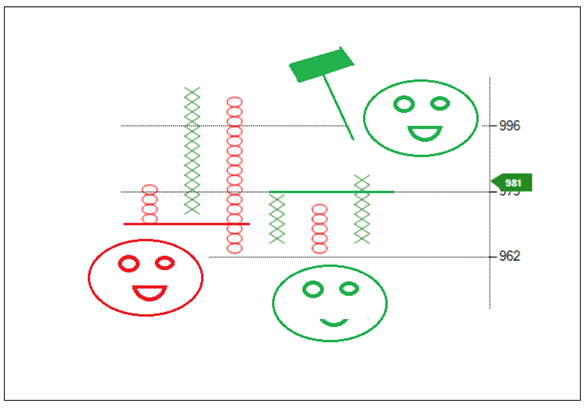
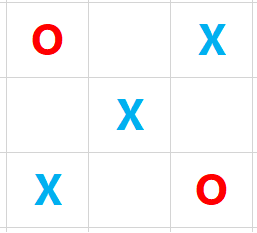
Point & Figure is an oldest charting method where price is plotted vertically, and the chart moves only when price moves. It is a different way of looking at the price, the objective box-value and reversal value offers advantage of identifying objective price patterns.
Dec 5, 2020 19 tweets 6 min read
Thread: Parabolic SAR Indicator

Parabolic SAR (PSAR) indicator was developed by J. Welles Wilder.

#PSAR #Indicators #Definedge The calculation of this indicator is a bit complex, but the concept is extremely useful. I will try to simplify it and explain the logic. I will briefly explain the concept, calculation and reading.

Let us think about creating an indicator that shows the trend.
Nov 29, 2020 21 tweets 5 min read
Thread of threads I have written on the Twitter:

Link to my books, blogs and videos:
definedge.com/penned-by-pras… ADX Indicator

Sep 23, 2020 23 tweets 7 min read
Keltner Channel - Thread

#Keltner #Indicators #Definedge Image 
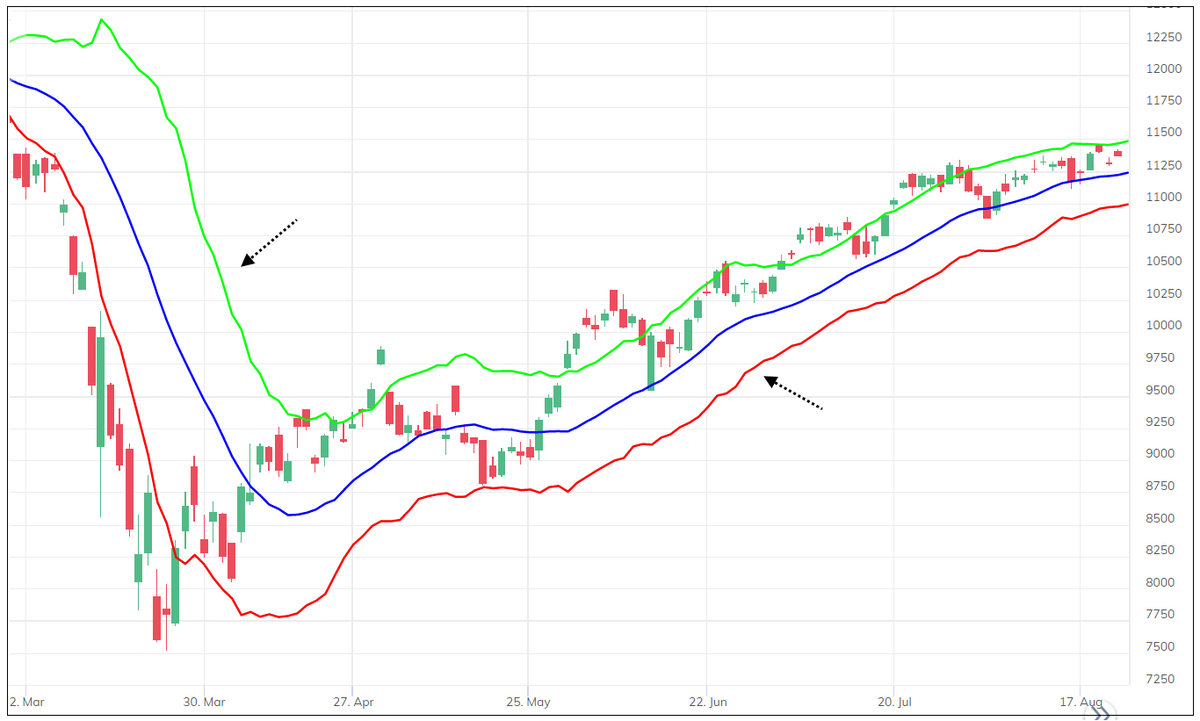
Chester W. Keltner (1909-1998) was a Chicago grain trader. He worked with successful traders who back-tested trading systems. He talked about Ten-Day Moving average trading rule in his book 'How to Make Money in Commodities' in 1960.
Sep 4, 2020 20 tweets 6 min read
Thread: Adaptive Moving Average (AMA)

AMA is an indicator devised by Perry Kaufman explained in his book Trading System and Methods. It is also known as Kaufman’s Adaptive Moving Average (KAMA).

#AMA #Adaptivemovingaverage #indicators #definedge Rate of change (ROC) is a study that measures how much price moved up or down from previous bar. The daily rate of change captures the trend. When we make it absolute, captures volatility.

Meaning,
Price went up or down by 10 points = trend
Price moved by 10 points = volatility