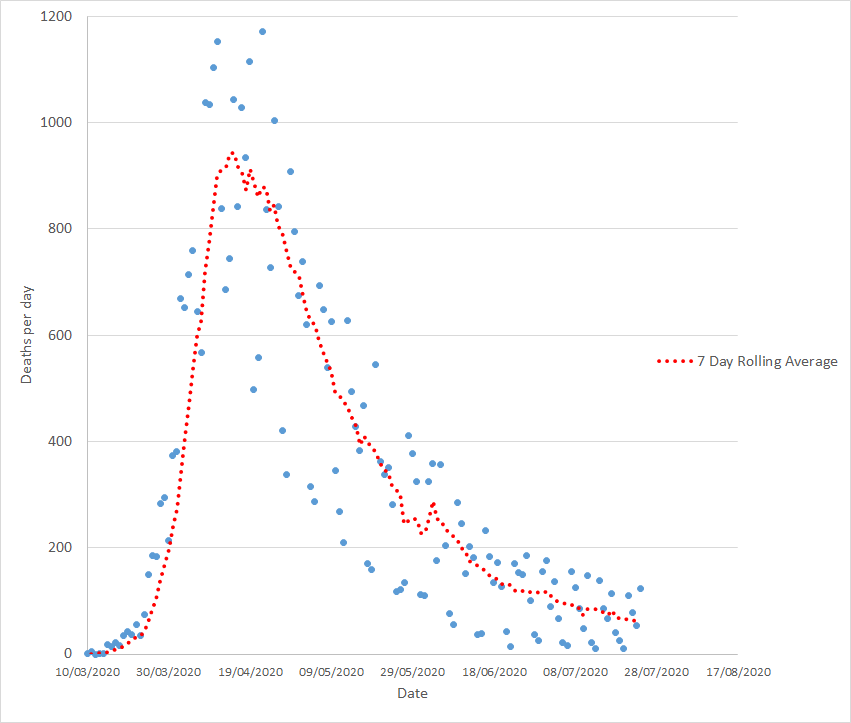
14 fatalities due to Covid-19 announced in the UK today. Sundays and Mondays are the most artificially low numbers we see, more of that presently. Here's the overall graph (1) 

This is a little under trend. But not enough to take our 7 day total down at all. But that would be unlikely on a Sunday. Here's a closer look at the recent trend (2)

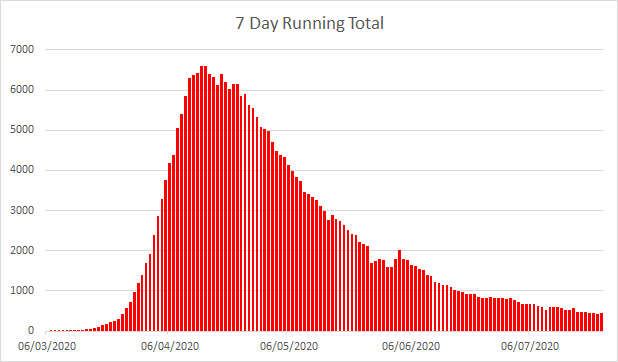
The variation between the proportion of weekly fatalities reported each day is increasing. If you look at the percentage of the seven day total each day, the spread is getting bigger. That means smoothing the data out gets ever more important (3)

So if we divide the seven day rolling total to by 7 each day we start to see a more believable graph. We can see from this that for the last 6 days or so fatalities have stopped falling, we have once again plateaued (4)
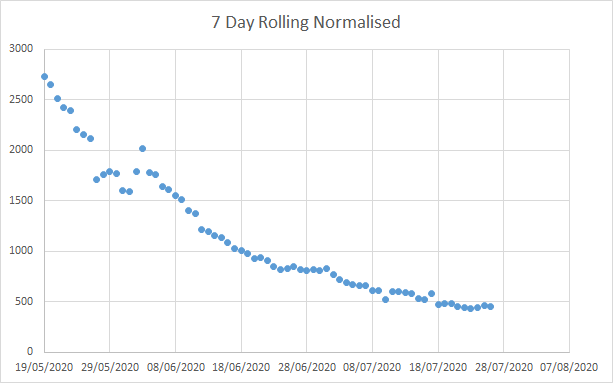
That shows best if we look at a log graph of the same data. The number of deaths per day has stopped falling. (5)

Which means that while people who were announced dead today caught Covid-19 the infection rate, R, was getting ever closer to 1 - for the fourth time since the rate of death started to fall (6)

We can now be confident that we have reached a fourth stalling point in the descent from peak Covid-19 deaths. Ultimately that means more deaths than we would otherwise expect to see. This corresponds more or less precisely with pubs and restaurants reopening 22 days ago (7)
The previous peaks in calculated R correspond with VE day weekend, lockdown being eased (beaches and parks crammed), and shops reopening (remember the queues shown in the news?)/demos. Those peaks represent a short term increase above the underlying Covid-19 death rate (8)
...and this fourth peak plots to when pubs reopened. The question we face now, and we won't know for a few days, is whether that is going to continue upwards (9)
Sundays and Mondays are artificially low reported numbers, Tuesdays to Saturdays give us the bulk of the reported deaths for the week. We'll know more on Tuesday, more again through the rest of the week (10)
So far the correlation between government policy changes that lift lockdown and more deaths has been absolutely rock solid, with a reversion afterwards as behaviour calms down. How bad it will be this time, we can't know yet (11)
If we're very lucky this will be it, and we'll start going back down straight away. It doesn't immediately seem likely though (fin)