How do I approach and trade?
-> Draw lines at Daily, weekly swing High & Low
-> Draw lines at hours resistance & Support
-> Now Check the trend on daily and hourly and board trade with 20% Capital size naked with Sl.
-> Either Sl or favour move.
-> Draw lines at Daily, weekly swing High & Low
-> Draw lines at hours resistance & Support
-> Now Check the trend on daily and hourly and board trade with 20% Capital size naked with Sl.
-> Either Sl or favour move.
->As price reach these drawn line, check it for acceptance or rejection.
->Moreover you would find, Price goes near a level and stick to it or sustains there, in almost all cases it’s gonna big trending day.
->Moreover you would find, Price goes near a level and stick to it or sustains there, in almost all cases it’s gonna big trending day.
-> As it gave breakout after consolidation but reverse very next candle, means BO traders has been trapped & 90% times there would b huge sharp fall in 2-3 candles back to day low.
-> If there is rejection, then trades accordingly.
-> If there is rejection, then trades accordingly.
-> Market reaches resistance and shows rejection, I ll short CE with same candle high as SL, next either Sl hit or favour.
-> If comes into favour, I ll exit at predefined calculated targets as per Eliot wave, Pivots, Price action you can follow anything, results are almost same.
-> If comes into favour, I ll exit at predefined calculated targets as per Eliot wave, Pivots, Price action you can follow anything, results are almost same.
If market seems range bound, play accordingly with non directional strategies.
Go through all chart for better understanding.
https://twitter.com/chartsbank/status/1279743818393243648?s=21https://t.co/vcxXsVhcqZ
Must means must for all to all through twice thrice these long sessions till you don’t stop loosing.
https://twitter.com/chartsbank/status/1288451779793784832?s=21https://t.co/RxZf9Mh1ln
https://twitter.com/chartsbank/status/1289448987385196545?s=21https://t.co/3esTDnNh2U
https://twitter.com/chartsbank/status/1291566305628184576?s=21https://t.co/nxKEOQ9J0v
https://twitter.com/chartsbank/status/1296141962131644416?s=21https://t.co/1Z0E48jhm3
For me price action means
What is #Trend
Does it hv #Momentum
Isn’t it #Over_bought_sold
Does #Volume supporting move
If options writing then view on #Volatity
Once you know these 5 things, make a system around this and you are done ✅
What is #Trend
Does it hv #Momentum
Isn’t it #Over_bought_sold
Does #Volume supporting move
If options writing then view on #Volatity
Once you know these 5 things, make a system around this and you are done ✅
To shorten the learning curve, watch at least 300-500 charts daily for 2 Qtrs only. Automatically you ll hv a @Chartsbank in your memory.
Next time when you ll see same pattern, you ll recall and say ...ohh yeah ..last time happened so & so..
Money is made this way only for me.
Next time when you ll see same pattern, you ll recall and say ...ohh yeah ..last time happened so & so..
Money is made this way only for me.
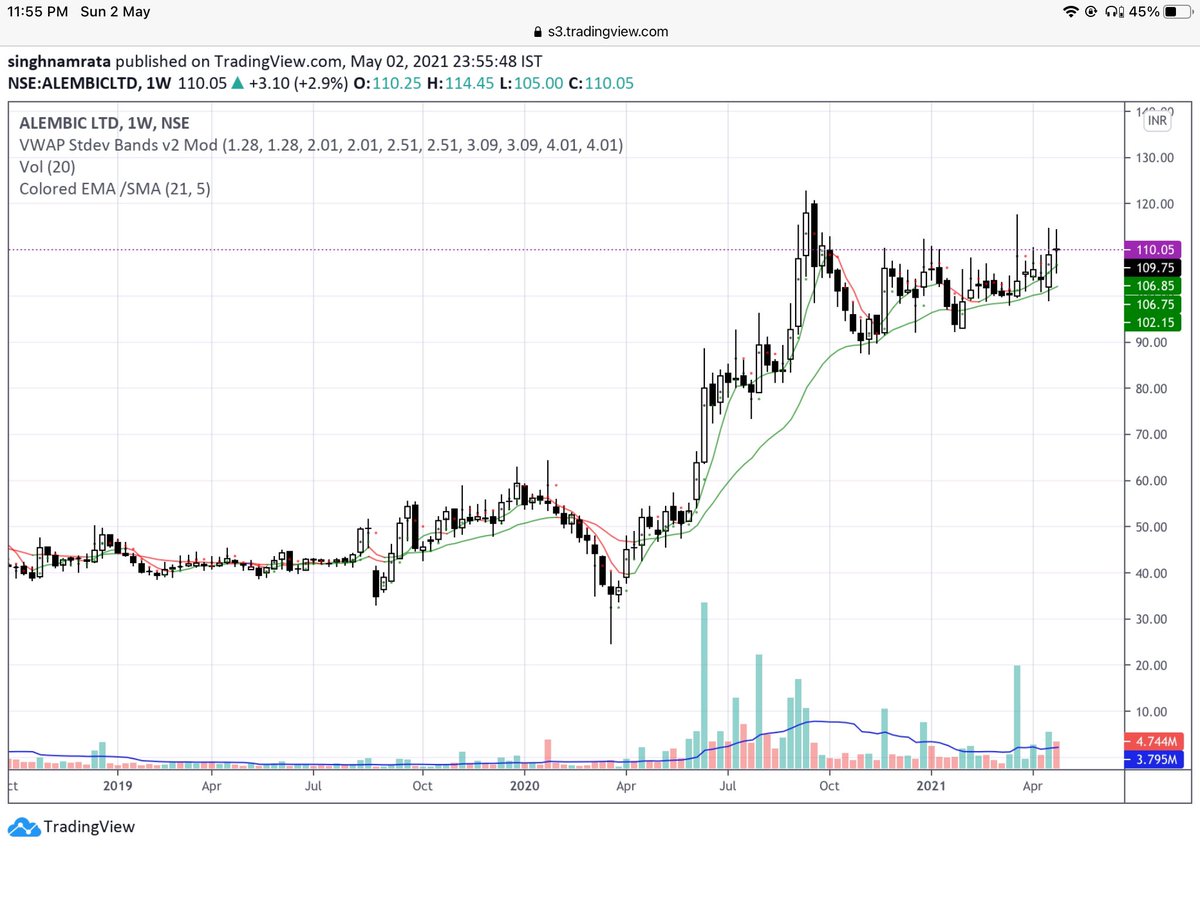
Respect a level, by remaining there restore strength (Make new base to defend) & FIRE🚀
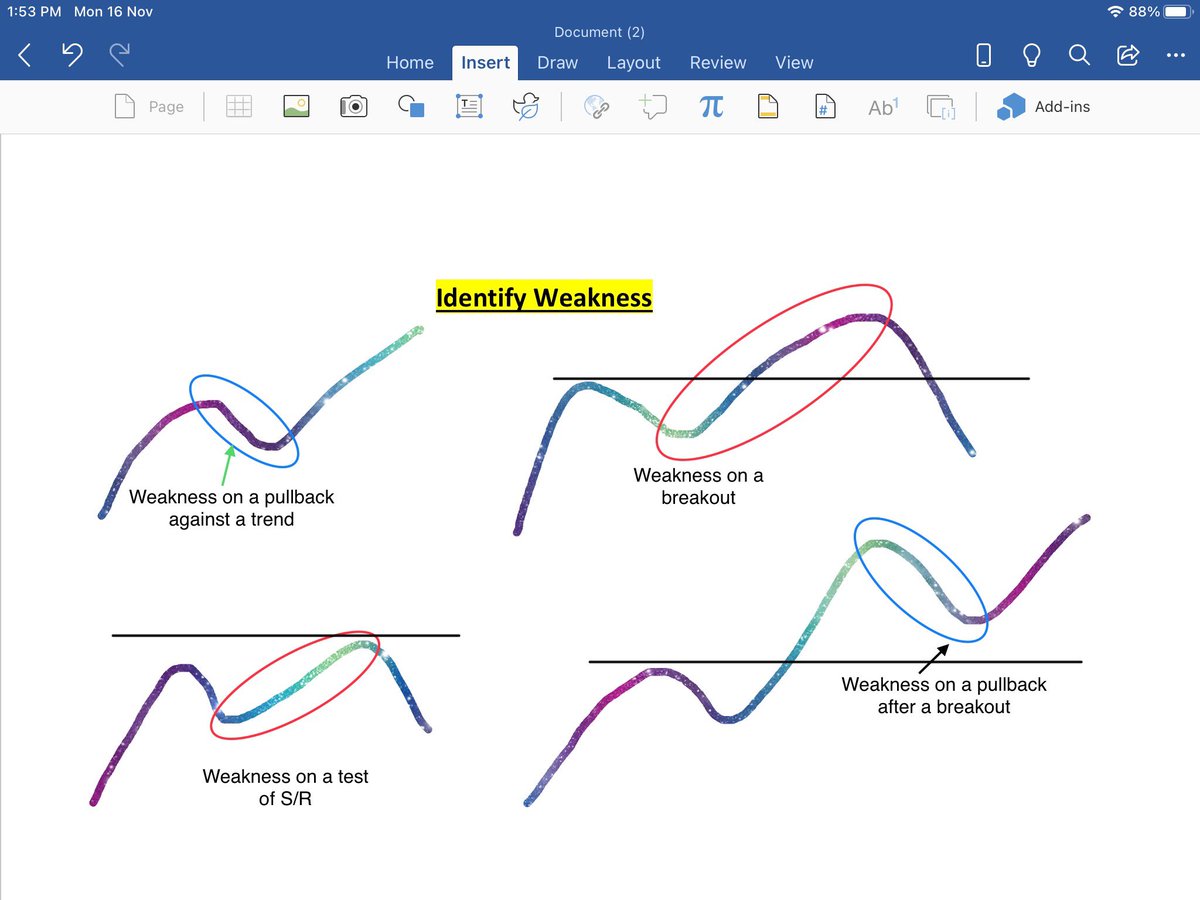
->First Identify weakness
-> Let it come S/R or mean reversion
-> Wait for Entry trigger
(a) Rejection Candle for Reversal
(b) Big body BO candle
-> Hold till it reaches another Demand/Supply zone.
-> Let it come S/R or mean reversion
-> Wait for Entry trigger
(a) Rejection Candle for Reversal
(b) Big body BO candle
-> Hold till it reaches another Demand/Supply zone.
If I m to summarise my trading experience then it would be 👇


If after giving a breakout or break down price comes back to range then most probably it will reach to another end of range.
That’s it.
That’s it.
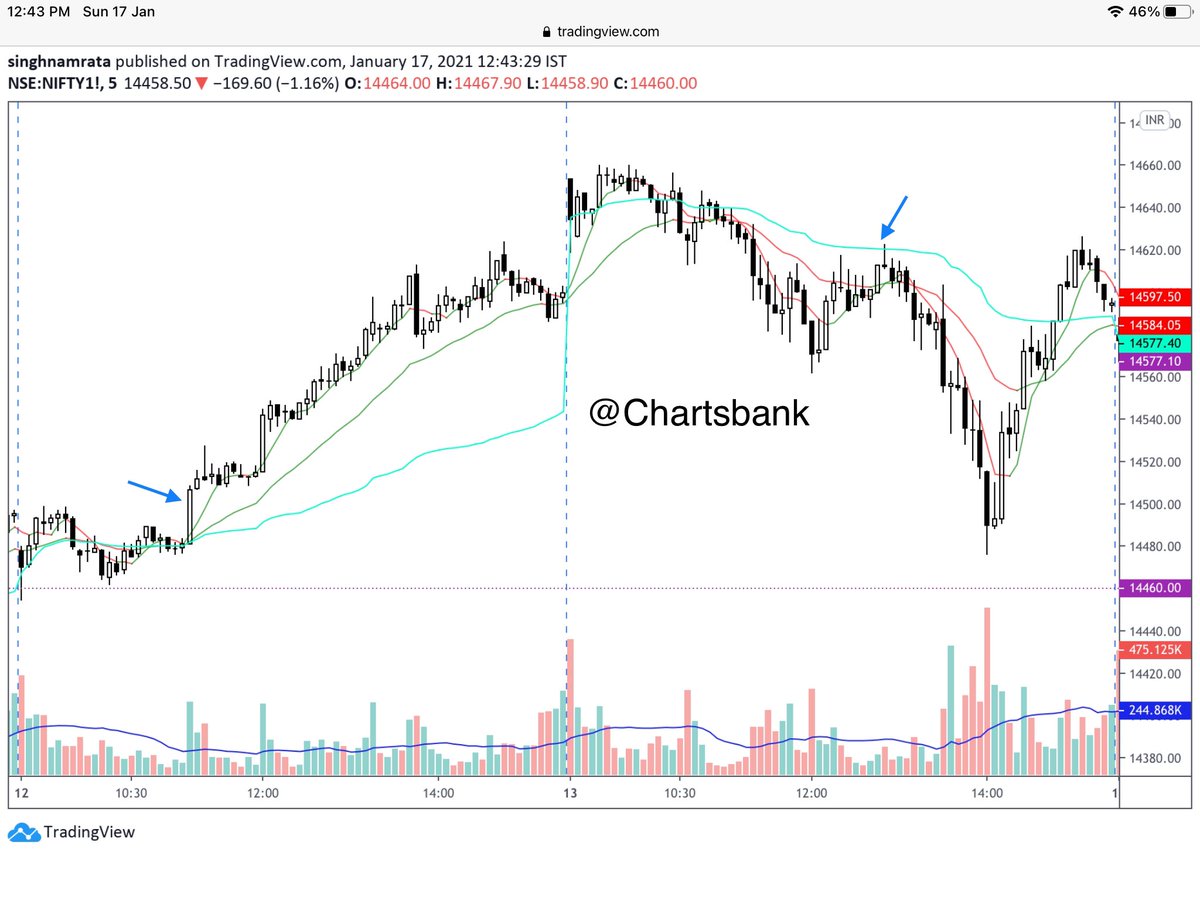
VWAP is only indicator which I give utmost importance & use because it tells which side big players are betting.
If it trades above this, my view is bullish or vice versa.
-> After Big candle
-> I scale in once price retraces to VWAP & make pin bars with Sl at other end.
If it trades above this, my view is bullish or vice versa.
-> After Big candle
-> I scale in once price retraces to VWAP & make pin bars with Sl at other end.
Yes, it’s perfect Example of what earlier shared.
PDL broken & rejection at VWAP making pin bar.
Sl is another End of pin bar.
PDL broken & rejection at VWAP making pin bar.
Sl is another End of pin bar.
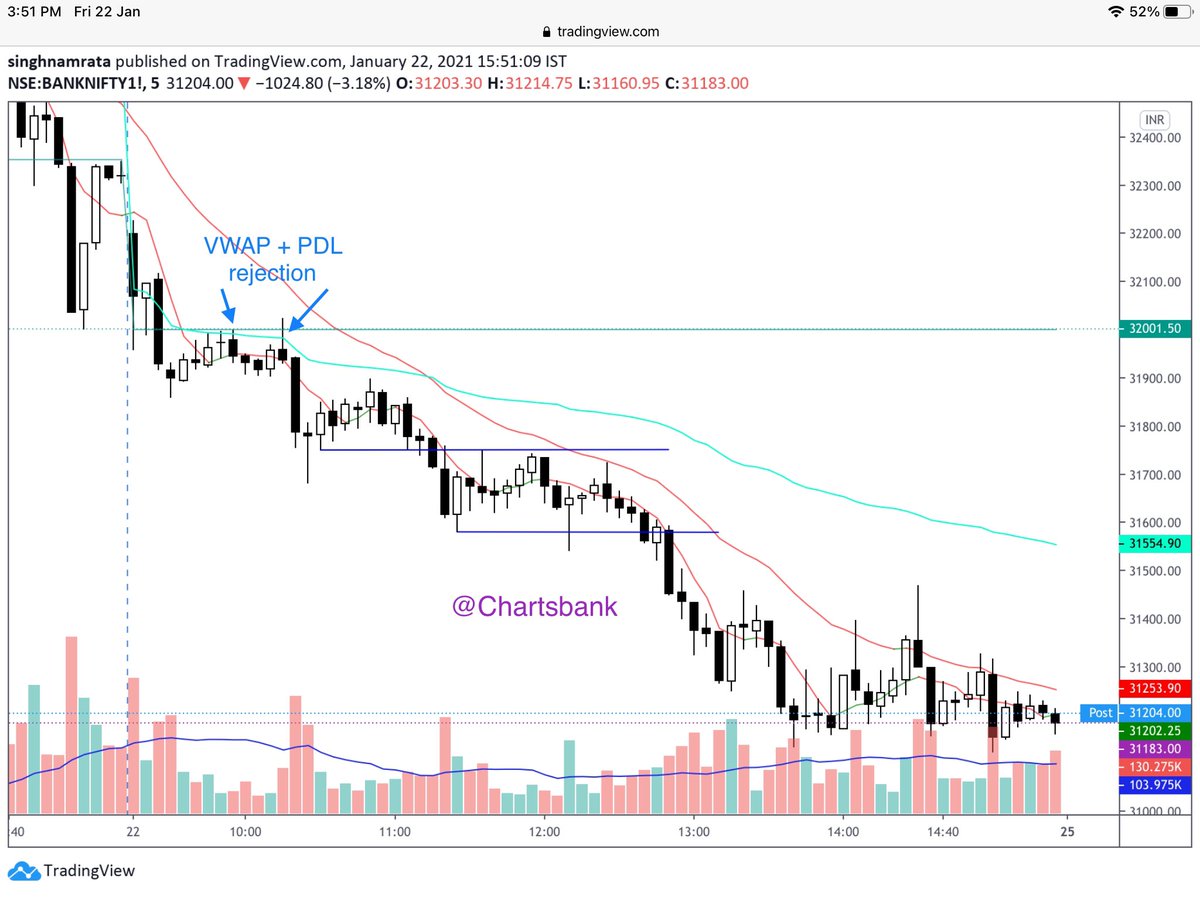
If you ”WAIT” till candle forms, yours more than 50% SL hits would be saved.
#experience
#experience
VWAP touch & back 2 base was only logic for me to exit all positions just before fall.

When you missed a major move, don’t board it out of FOMO.
VWAP is perfect place to enter.
VWAP is perfect place to enter.

If intraday trend is up, it works perfectly nice to buy 1-2-3 leg correction false BD.
If trend is down, then same for up-move false BO.
It works for all time frames.
If trend is down, then same for up-move false BO.
It works for all time frames.
This is how usually I play contra.
All arrow must have rejection candle in place as respective levels to qualify for Entry Signal.
All arrow must have rejection candle in place as respective levels to qualify for Entry Signal.

A trader / Investor can make money via 3 way only. Now decide yours.
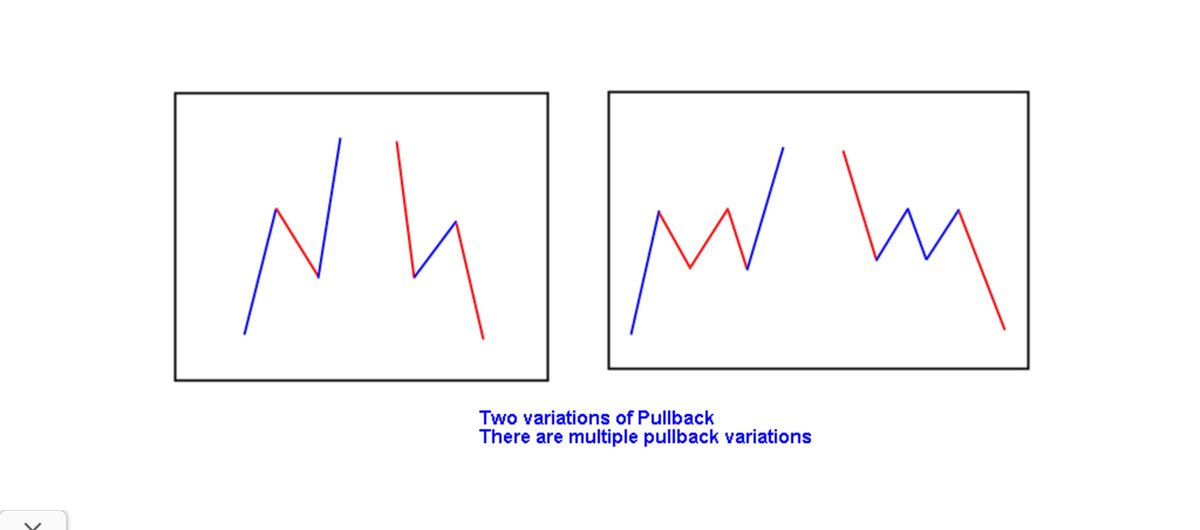
1. Resumption in a trend following a pull-back. No automatic buy at pull back too. Wait for PA confirmation.
2. Top and bottom picking on the basis of exhaustion
3. Break-outs or break-downs.
1. Resumption in a trend following a pull-back. No automatic buy at pull back too. Wait for PA confirmation.
2. Top and bottom picking on the basis of exhaustion
3. Break-outs or break-downs.
More than 75% of my trades are trading S/R & Trendline,
because there we get huge rewards with little limited risk once move comes in favour.
because there we get huge rewards with little limited risk once move comes in favour.

In 4th screenshot record, also add RR along with Profit/Loss.
Also attach that chart day chart to dig deeper.
Also attach that chart day chart to dig deeper.


Do you know this.
Beginners don’t dare to adventure outside of this Nifty 500.
Beginners don’t dare to adventure outside of this Nifty 500.

This one comes from Piyush sir, a well known face in ELLIOT Wave.
Just go ahead without second thought.
Thanks sir for sharing this valuable content.
Just go ahead without second thought.
Thanks sir for sharing this valuable content.
https://twitter.com/piyushchaudhry/status/1412019996830560258
->Weekly TF have resistance, daily TF gives BO then wait & watch.
-> Candle stick pattern do wonders if used in conjunction with S/R.
-> If in uptrend / above 20 MA , ignore negative pin bars or vice versa.
-> Candle stick pattern do wonders if used in conjunction with S/R.
-> If in uptrend / above 20 MA , ignore negative pin bars or vice versa.


What is confluence?
Sharing reasons to get long in below charts
-> Uptrend
-> Resistance cum support
-> MA support
-> Fibonacci
Sharing reasons to get long in below charts
-> Uptrend
-> Resistance cum support
-> MA support
-> Fibonacci

If no one or less participation on higher levels to buy, then also price drifts to lower levels, just to meet demand. It’s a nature of uptrend.
Means price goes up steadily.
Whereas in down trend are more clear & more rewarding since market don’t go up without serious buying.
Means price goes up steadily.
Whereas in down trend are more clear & more rewarding since market don’t go up without serious buying.
if the moving average crosses over another, it is a signal of a trend reversal.
These are the days, when big money is made, options freeze happens as most ppl not ready to accept the change.
On range bound day, nothing would work as above mentioned.
Trading S/R makes sense.
These are the days, when big money is made, options freeze happens as most ppl not ready to accept the change.
On range bound day, nothing would work as above mentioned.
Trading S/R makes sense.
Trading #Inside_bar with BO/BD Continuation of trend.


Trading Traps or false BO/BD


Performance of Chartsbank Algo for BN on Tradetron platform.
To get started sign up, link is given in profile 👆 and search and subscribe for free .
Stay tuned..
To get started sign up, link is given in profile 👆 and search and subscribe for free .
Stay tuned..
https://twitter.com/Chartsbank/status/1431610806907461633
A hunt for truth.
https://twitter.com/Chartsbank/status/1450463570739748864

A place worth to visit or own if one can.
#Goal_2035
#Goal_2035
https://twitter.com/ITRADE191/status/1461960116152913923
Today #Expiry learning:-
Nifty weak, BN shows strength -> Keep trading BN
As Nifty goes for pull back based on TL (SC) then BN gonna fire.
Here use HH-HL or any TL based pattern in BN & sq off all.
Switch to NIFTY then or vice versa.
Nifty weak, BN shows strength -> Keep trading BN
As Nifty goes for pull back based on TL (SC) then BN gonna fire.
Here use HH-HL or any TL based pattern in BN & sq off all.
Switch to NIFTY then or vice versa.
I have Market wizard series in watchlist to read for year 2022
Some learning
Some learning
https://twitter.com/JigyasuInvestor/status/1484373030814240768?t=r9YOdB5EEyD1JjlnYHzA4Q&s=19
• • •
Missing some Tweet in this thread? You can try to
force a refresh