1/ Covid (@UCSF) Chronicles, Day 136
San Francisco is experiencing a surge, so it might seem odd to focus on what SF has done –& continues to do– right. But w/ all the news about California’s surge, SF’s remarkable success story is in danger of being forgotten. It shouldn’t be.
San Francisco is experiencing a surge, so it might seem odd to focus on what SF has done –& continues to do– right. But w/ all the news about California’s surge, SF’s remarkable success story is in danger of being forgotten. It shouldn’t be.
2/ Yesterday, SF’s health director (& my former resident) Grant Colfax offered gloomy projections (“as many as 1800 deaths by the end of the year”) & committed to opening new hospital beds in the city tinyurl.com/y54xq89s. While it’s Grant’s job to paint worst-case scenarios…
3/ … if I were a betting man, I’d take the “under” on that one. SF remains the best performing major city in the U.S. w/ Covid. Even as we’ve let things slip since Memorial Day, we're still doing relatively well, compared with other parts of the nation, and to the rest of CA.
4/ Today, I’ll review SF's experience & highlight some things the city has done well. Perhaps there are a few useful lessons for other regions, though some parts of SF's success likely owe to political, organizational & cultural differences that may be tricky to replicate.
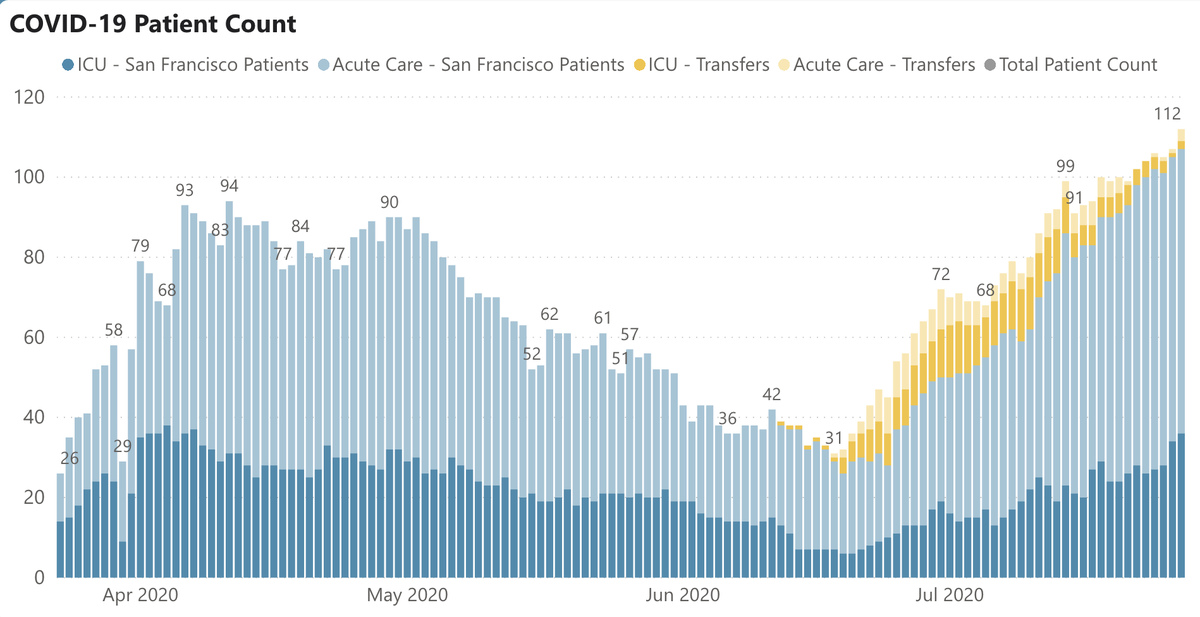
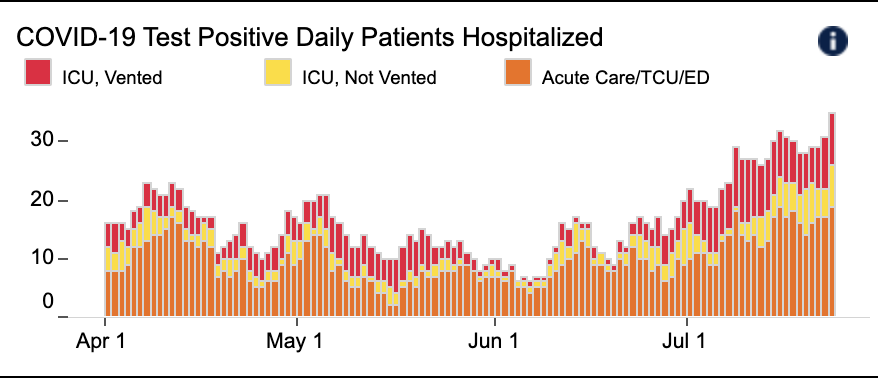
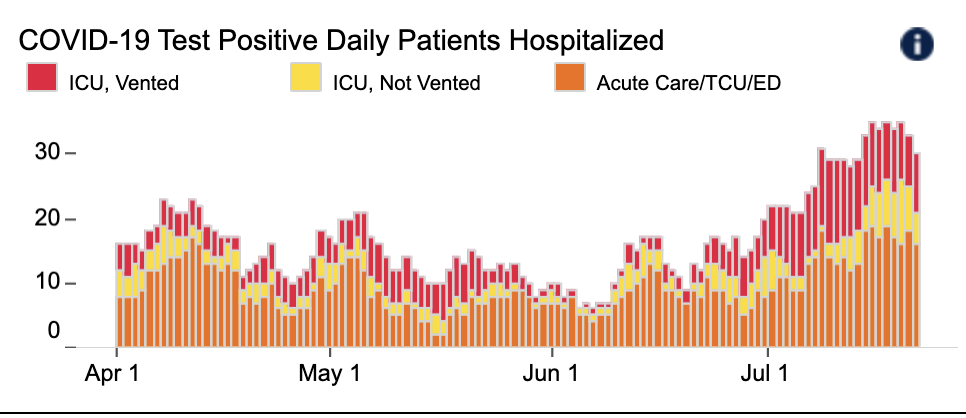
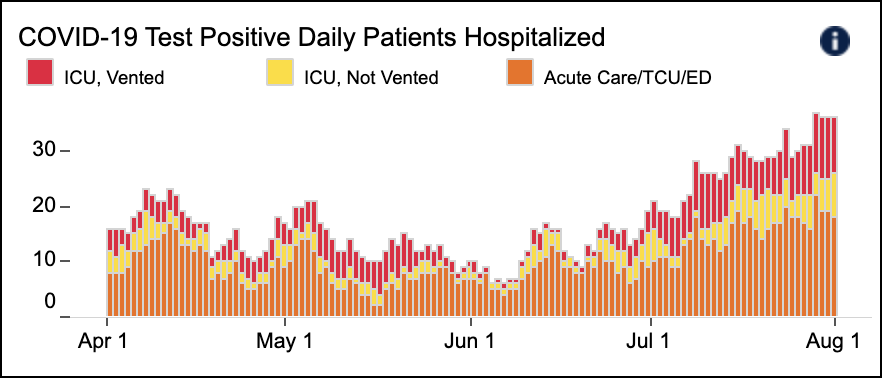
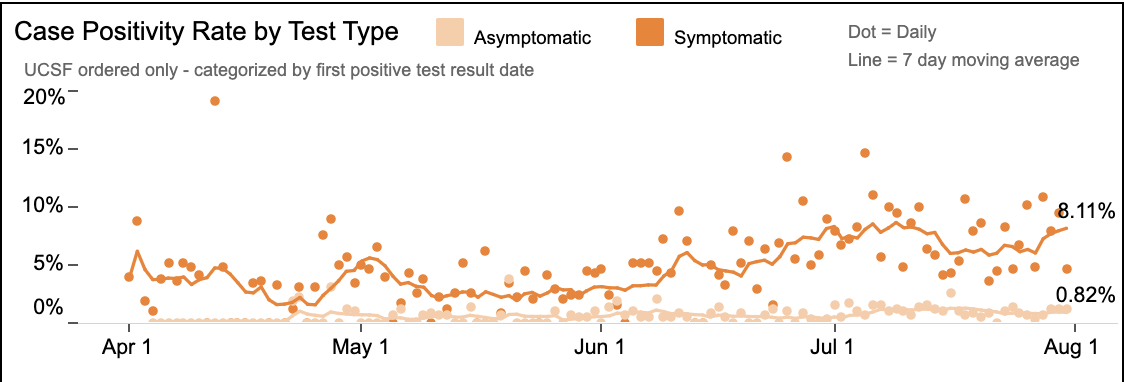
5/ Let's start w/ some # s. @UCSFhospitals: 36 pts, 10 on vents (Fig L). Stable x 4d, but 3x bump from May. Test + rate stable: 2.3% overall; 8.1% in pts w/ symptoms, 0.8% in asymptomatic pts (Fig R). More Covid @UCSF, but not straining capacity or compromising care of other pts. 
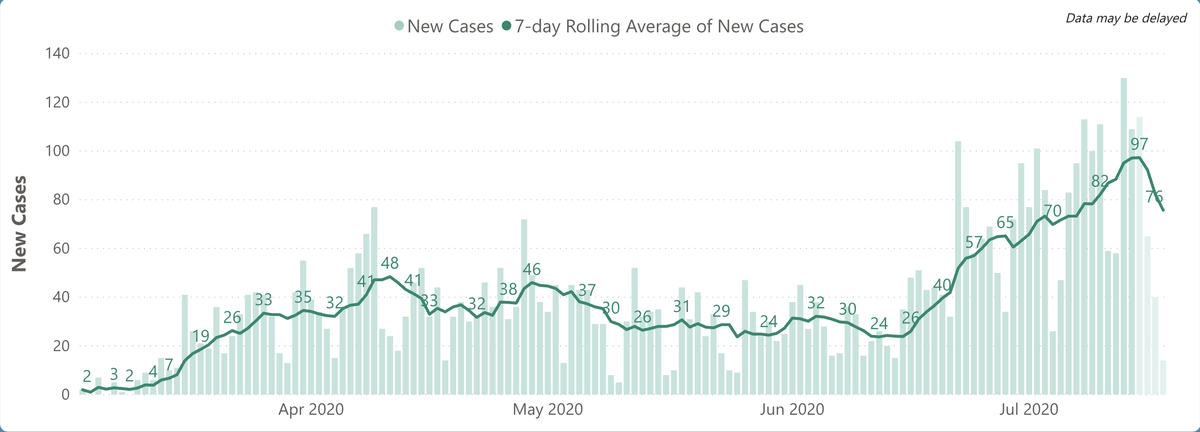
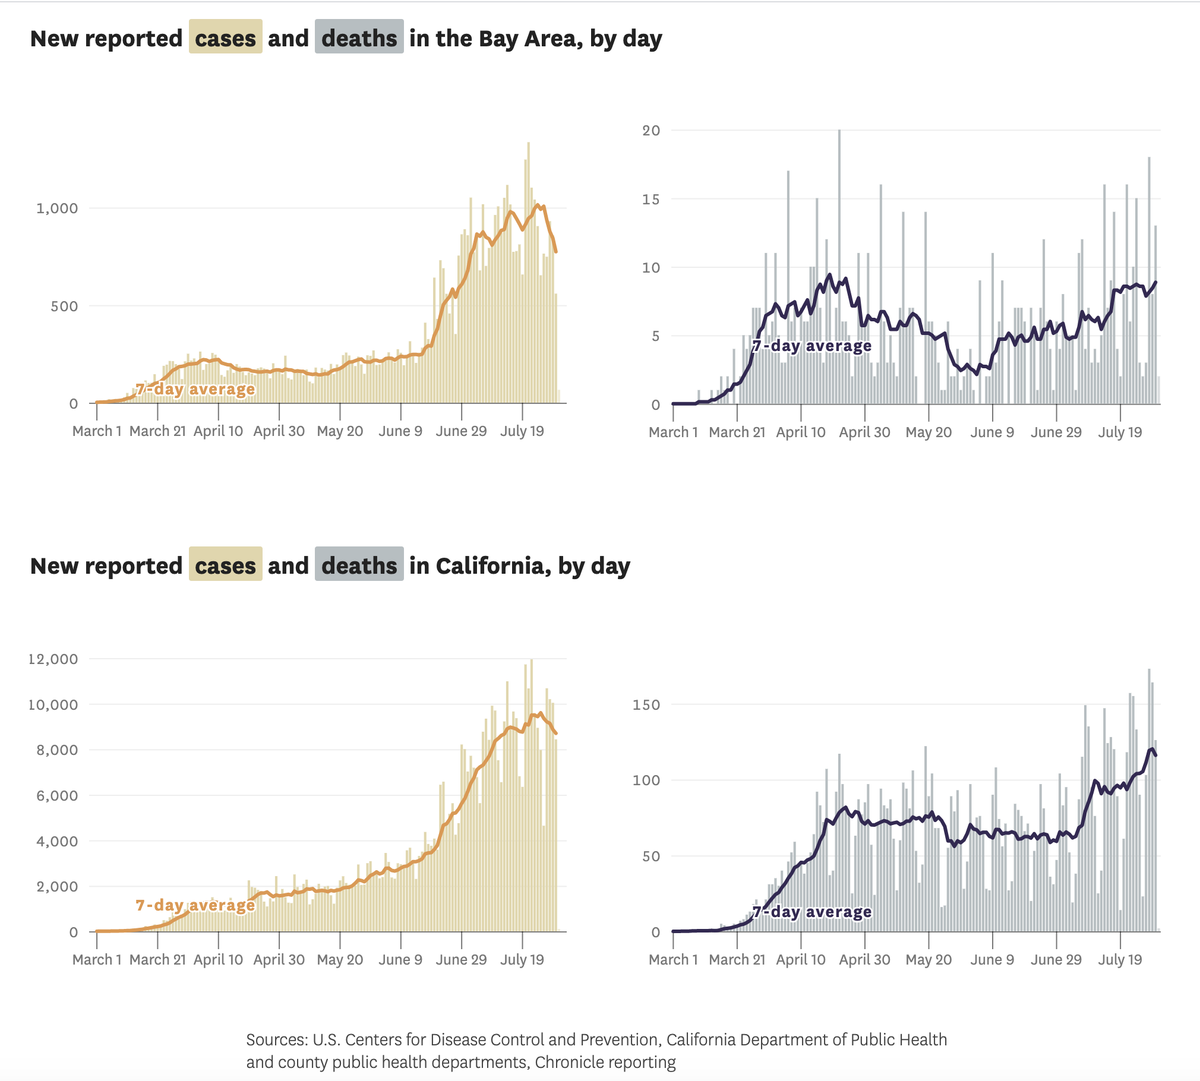
6/ Turning to SF, cases now averaging ~100/d, also about 3x April-June level. Now up to 59 deaths in the city. Graphs of Bay Area & CA cases/deaths show slight fall in cases in both (one always worries about a lag here) & mild upticks in deaths, worse in CA than in Bay counties.
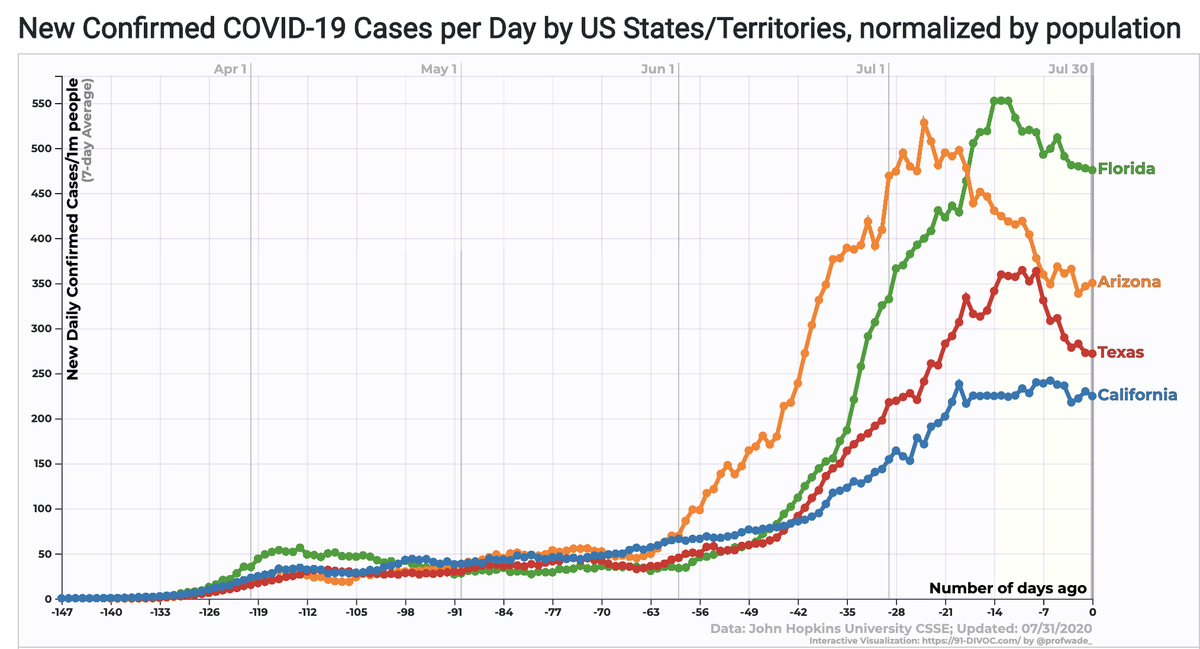
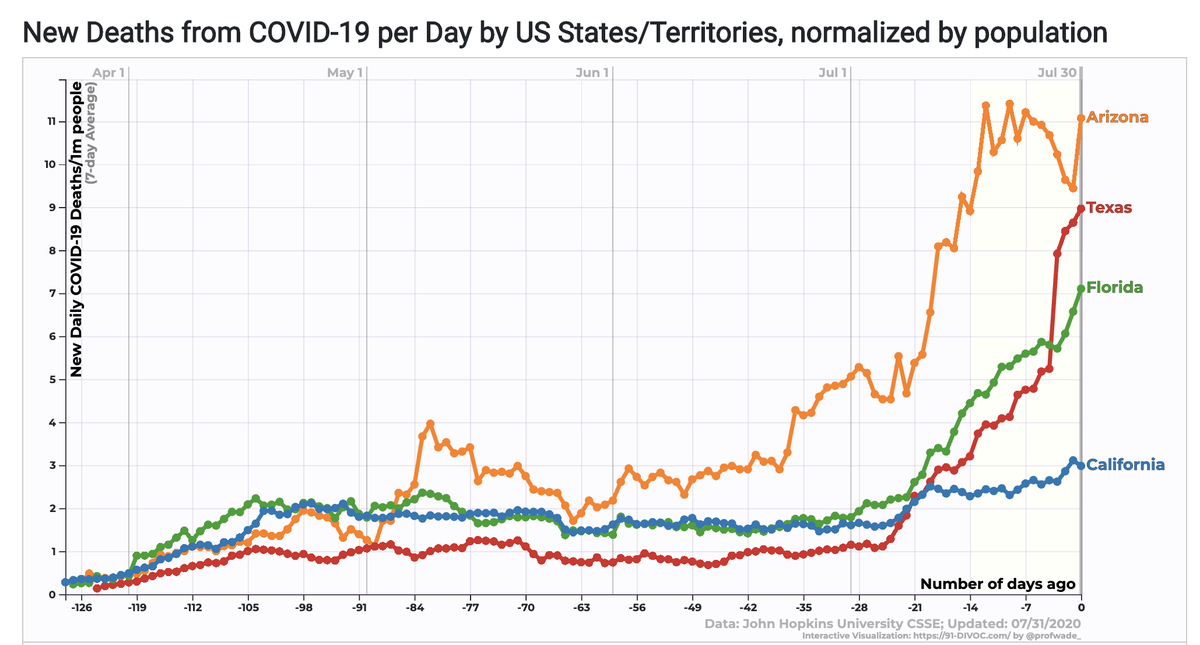
7/ Bit more on CA, before deeper dive into SF. On L, cases (adjusted for population) in CA, compared w/ other surging states. Yes, CA is surging, but well below AZ, FL, & TX (nice to see AZ & TX improving). On R, mortality: AZ, FL, TX steeply rising; CA’s bump is more gradual.
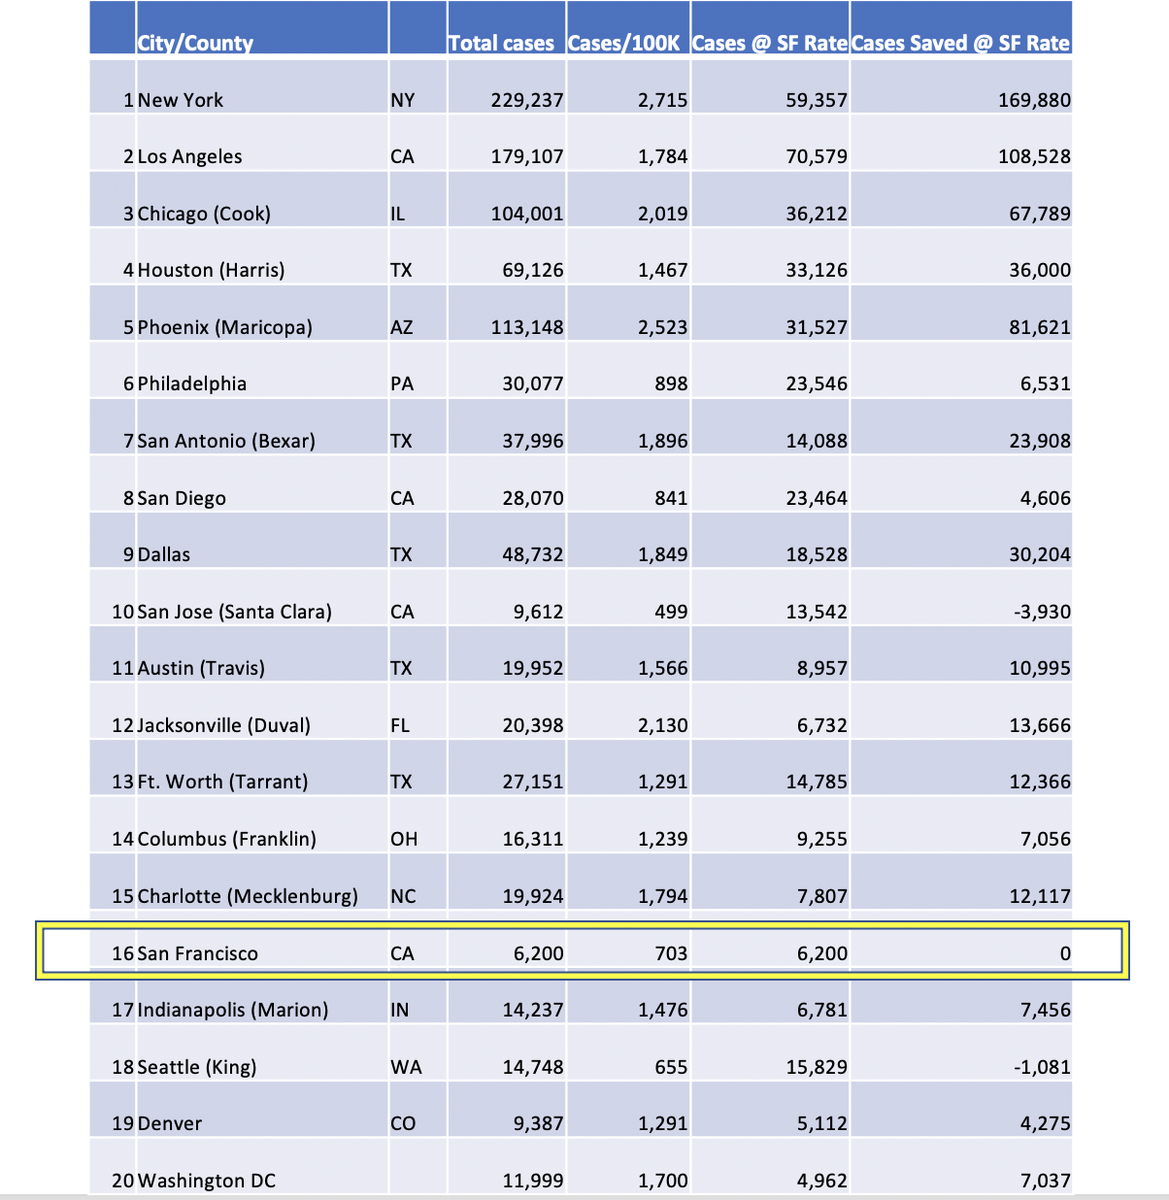
8/ OK, on to SF. Amidst the gloom & disappointment, let’s stop to highlight the city’s remarkable experience so far. Fig below (data drawn from @NYTimes tinyurl.com/t9j9fdw) shows the rate of cases and deaths (totals & per/100,000 people) in the 20 largest cities in the U.S.
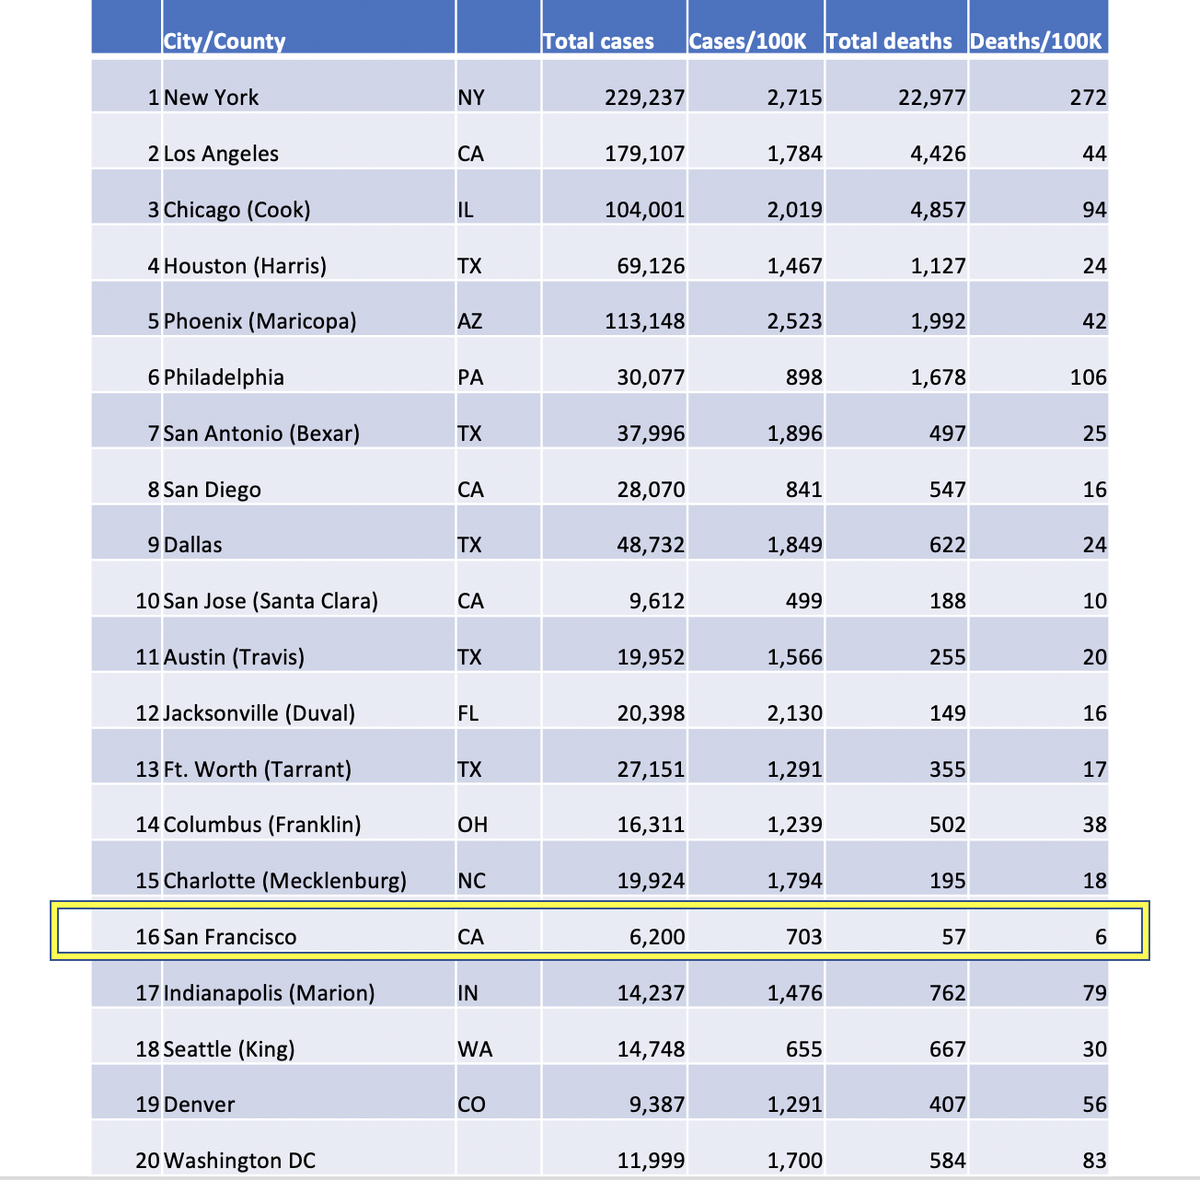
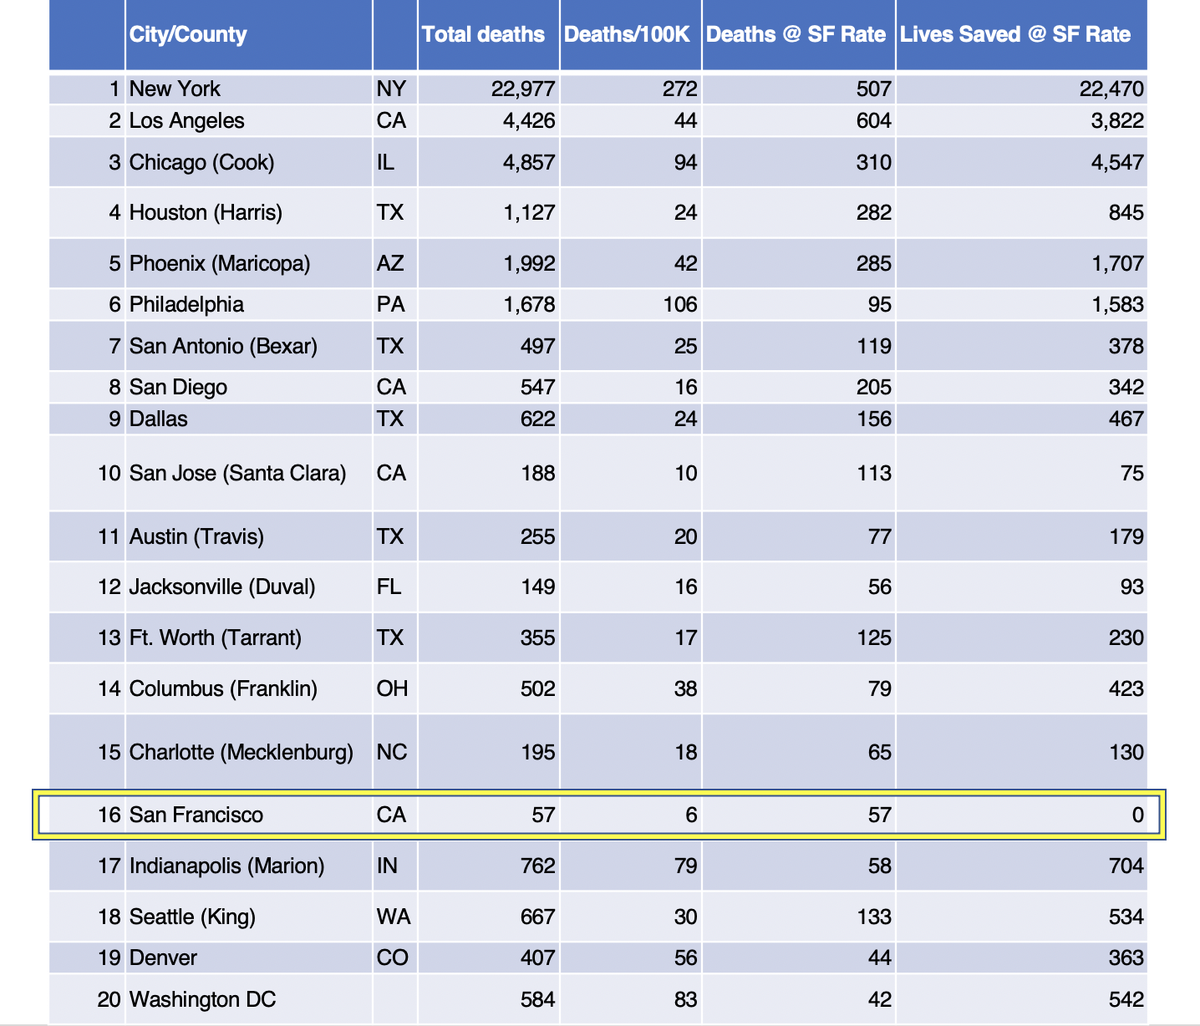
9/ The chart above shows that SF, 16th largest city, has the 3rd fewest cases/capita, bettered only by neighboring Santa Clara (incl. San Jose/Silicon Valley) & Seattle. But at 6/100,000, SF’s death rate is the lowest by far. Most cities are at least 3x higher; NYC is 45x higher.
10/ In chart below, I’ve calculated how many cases these cities/counties would've had, had they matched SF’s case rate. Then the last column shows how many fewer cases they would have had. Few examples: LA would have had 108K fewer cases, Phoenix 81K, Houston 36K, and Dallas 30K.
11/ Most astonishing: deaths. Now, last column is: how many fewer deaths cities would have had if their mortality rates matched SF’s. NYC would have had 22K fewer deaths. LA 3800, Chicago 4500, Philly 1600. All 19 cities combined: 39,434 fewer deaths, had they matched SF’s rate.
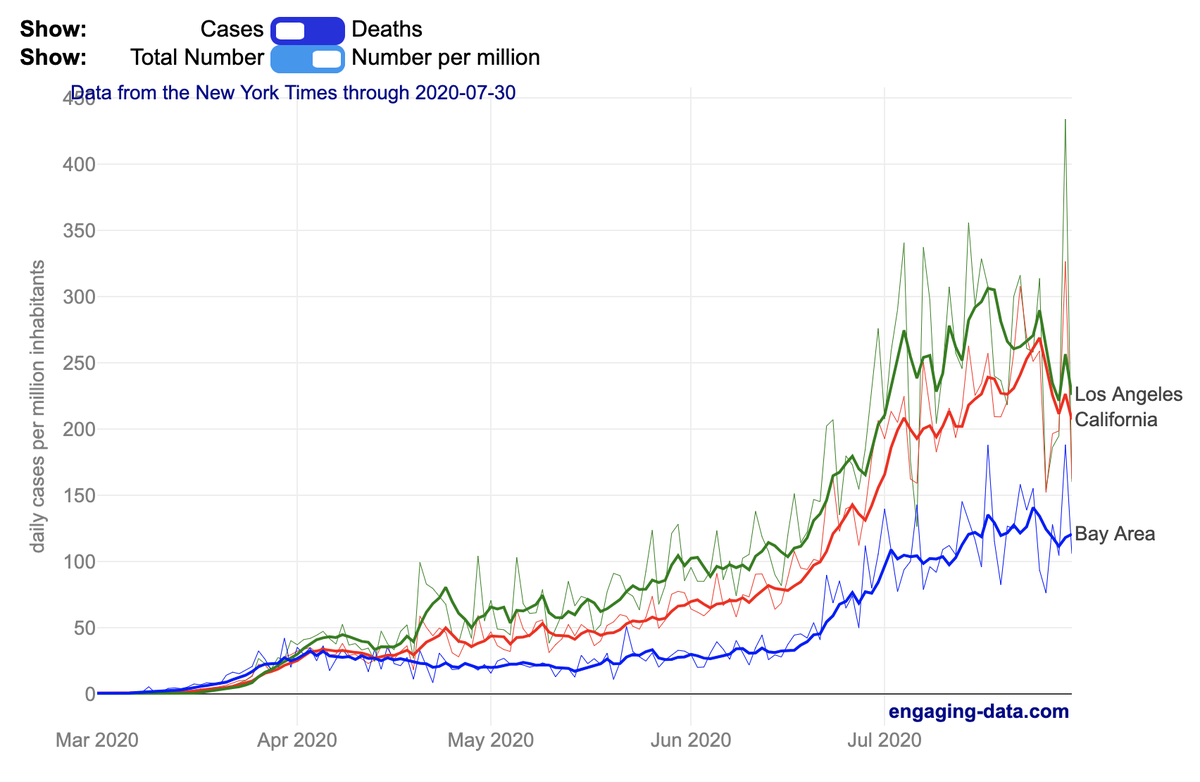
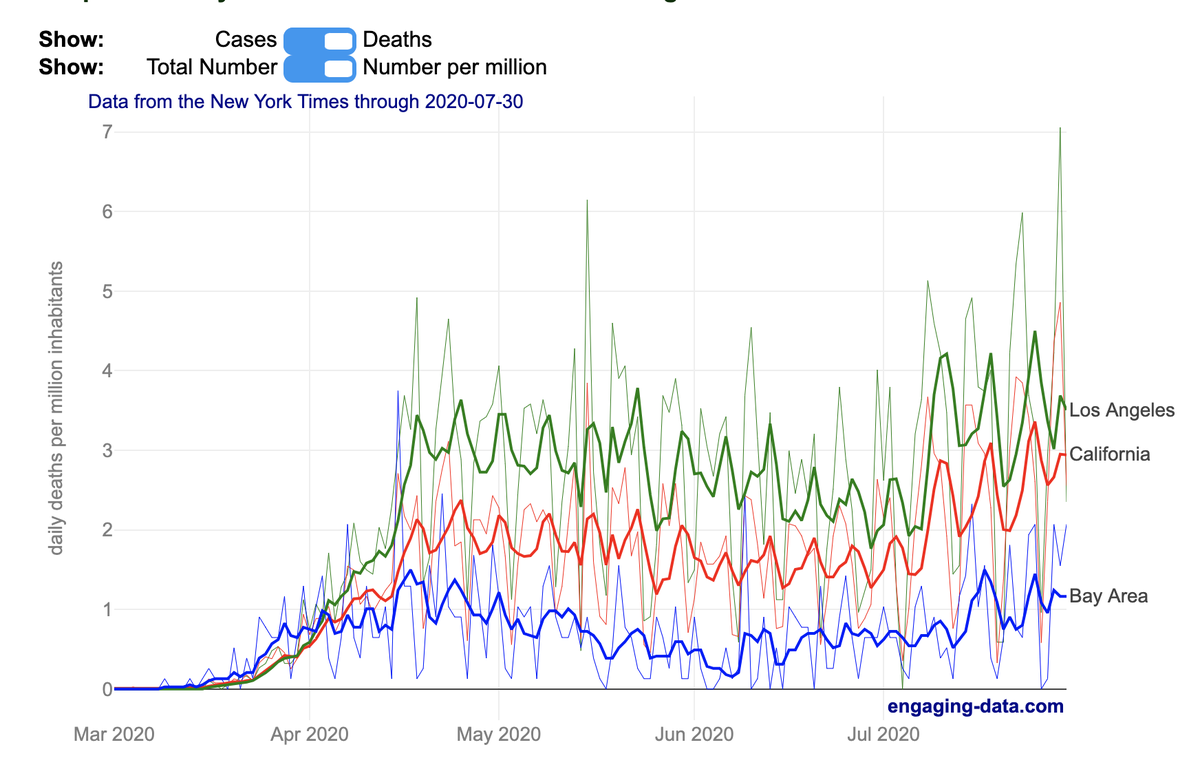
12/ A challenge in thinking about “CA surge” is that the surges in SoCal & NorCal are very different – not surprising in a state w/ 40M people & a Gross State Product larger than England’s GDP. Figs: Bay Area (SF & surrounding counties) vs. LA, cases (L) & deaths (R) per million.
13/ So even w/ our mini-surge, SF has done pretty well. I’ve written about March-May (tinyurl.com/ybaoq9yf): our early successes reflected a combination of strong political leadership, corporate leadership, actions by our people...& luck. Going forward, it’s more about skill.
14/ Strong political leadership, incl. by Mayor @LondonBreed & health leaders, has been key. As ex-HHS secty Leavitt said, "Everything we do before a pandemic will seem alarmist. Everything we do after...will seem inadequate.” SF’s leaders have made courageous, data-driven calls.
15/ Bay Area corporate CEOs, esp. in tech, also acted boldly, telling workers to stay home well before any other leaders did. (Yes, it’s easier to work from home if you’re a Googler than a factory worker, but still.) Notably, Google & Apple just extended work-at-home till 2021.
16/ The people of SF, while fully up for "making good trouble,” generally believe in science & don’t reflexively reject sensible evidence-based directives. We’ve had no “give me liberty or give me death” bluster, nor gun-toting libertarians storming City Hall. Thank goodness.
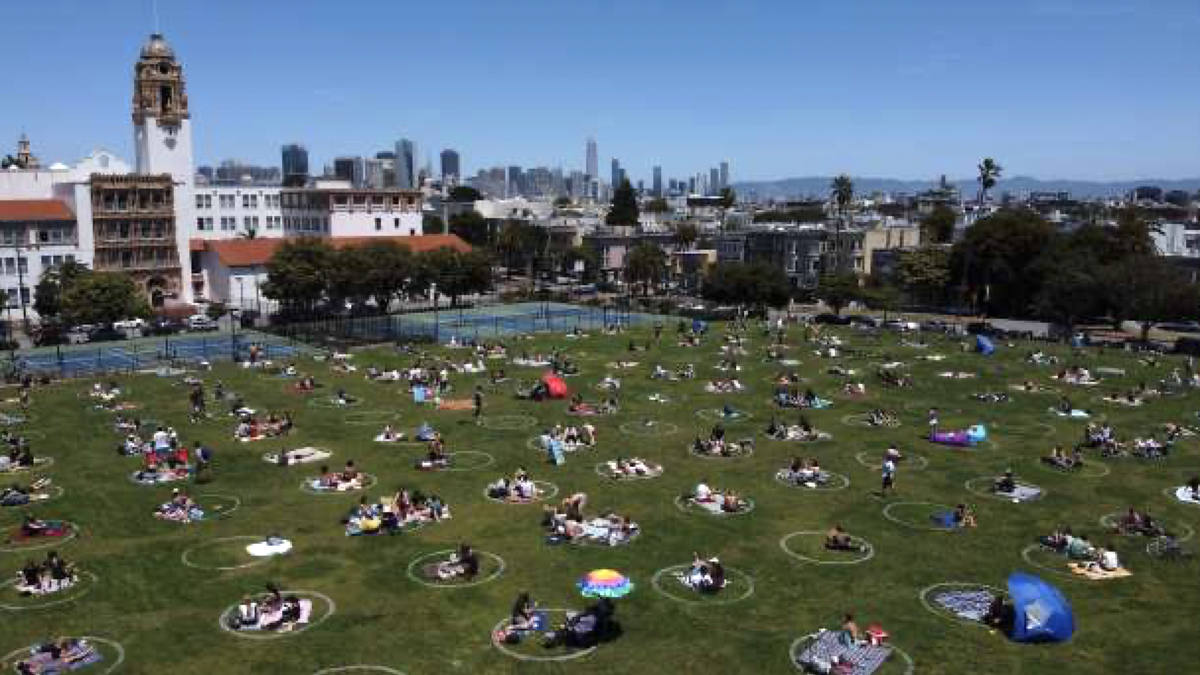
17/ And, while people have let their guards down, my impression is that there’s less of it here than elsewhere. Below, a striking picture from Dolores Park, a few blocks from my house. (I know not everyone is always this with-the-program, but you get the idea.)
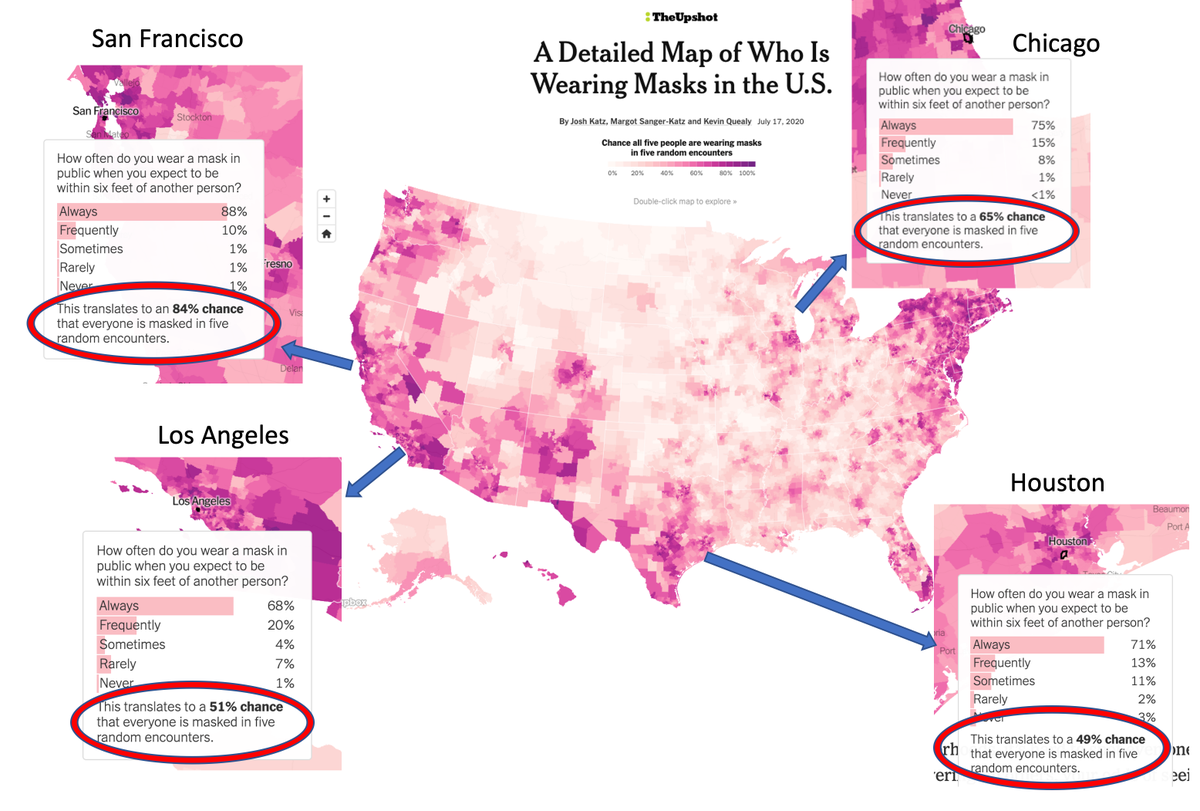
18/ And, mask wearing in SF, while not 100% universal, is pretty darn good – combo of strong & consistent messaging from leaders, and people doing the right thing. Below, @nytimes (tinyurl.com/yxfu375k) estimates of masking in SF (84%), LA (51%), Chicago (65%), and HOU (49%).
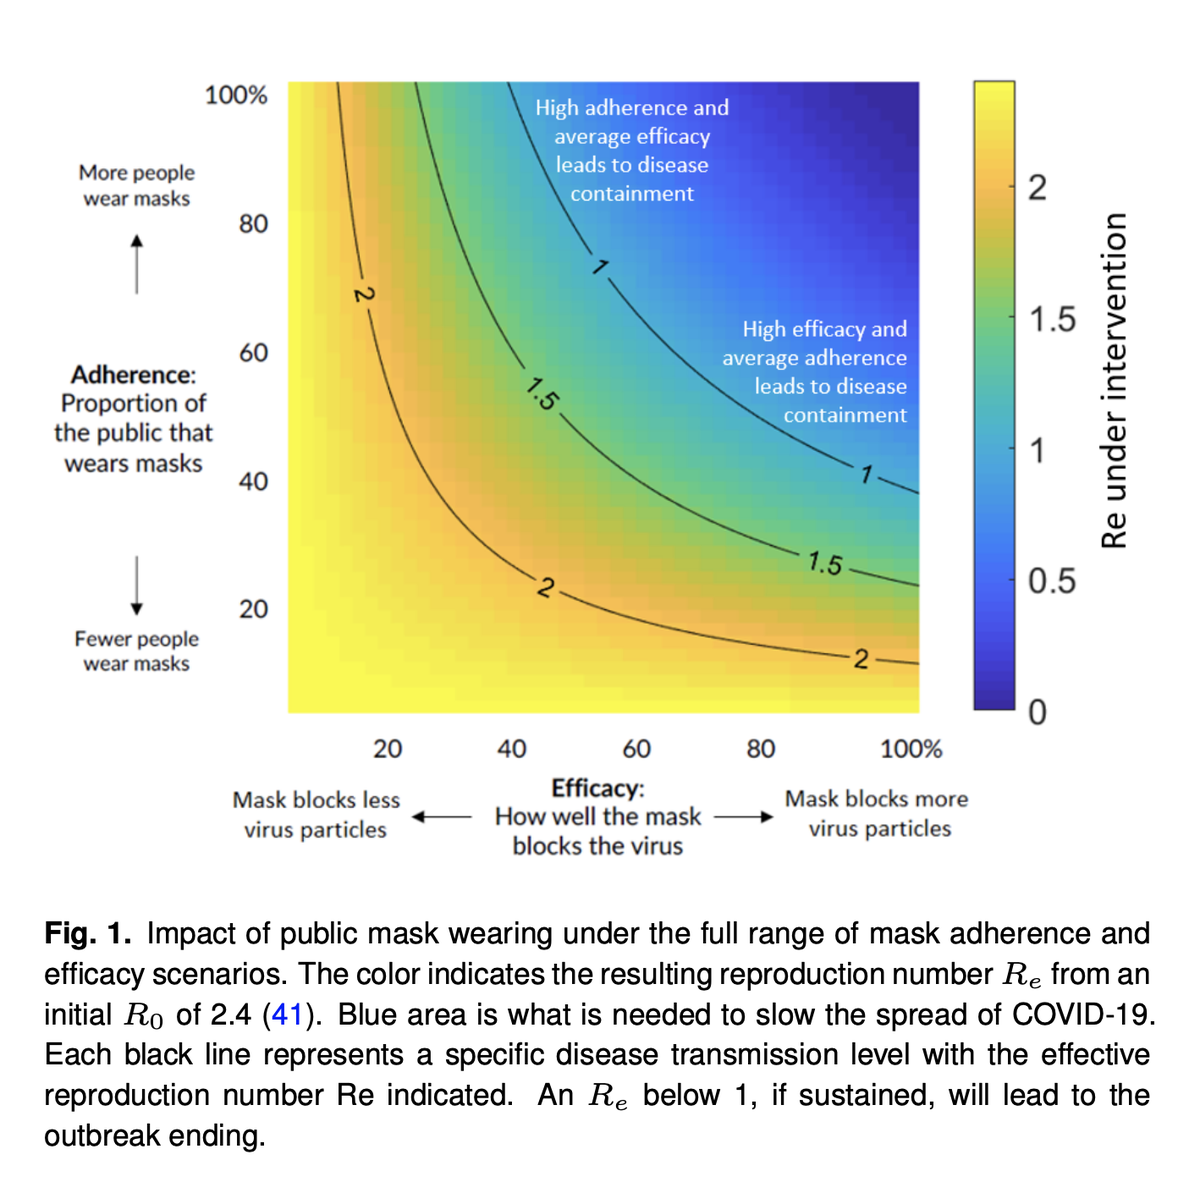
19/ As @jeremyphoward’s mask paper tinyurl.com/ybzsqrku shows, if we’re using masks that block viral spread by 60% (a reasonable estimate), going from 50% mask wearing to 80% lowers the transmission rate from ~1.4 to <1.0 – the difference between epidemic spread & suppression.
20/ The Daily highlighted precious little sharing in NYC between public hospitals & private ones tinyurl.com/y3m9whsy. In contrast, SF has seen terrific cooperation between public & private systems. We’ve shared pretty-much everything (PPE, testing, guidelines) from day one.
21/ And @SF_DPH, perhaps the best city health dept in the U.S., has (w/ @UCSF) launched superb contact tracing programs, partly by training librarians tinyurl.com/y6x9wukf. SF's tracers reach >80% of contacts; in many other regions, the numbers are more like 20%, or zero.
23/ SF’s situation isn’t perfect. Like others, we’ve seen troubling disparities, particularly in Latinx community. But even here, there’s been real collaboration between community & @UCSF/@SF_DPH tinyurl.com/y5eonydw, leading to promising interventions tinyurl.com/y68ck9fa
24/ In his seminal “Hammer and the Dance” tinyurl.com/yx27etx9, @tomaspueyo argues that the optimal Covid strategy was initial lockdown – giving the system time to get ready – followed by a measured opening that takes advantage of the prep time to avoid being overwhelmed.
25/ While SF's current status is worse than we'd like, it has hammered & danced better than any major U.S. city. If we follow Pueyo’s advice, we’ll tug the reins on opening, do some cheerleading, & get the city back on track. Based on the past 5 months, don’t bet against it. /End