Harish Krishnan,CFA Profile picture
Aug 1, 2020 12 tweets 3 min read Read on X
Seeing quite a few posts on record high P/E ratios etc of Indian equities. Small theoretical exercise to potentially highlight the optical nature of a ratio like trailing P/E ratio especially in context of a massive shock like Covid Image
Assume a 2 stock index, company A which is generally been a compounder & has a resilient biz model and company B which was barely growing and vulnerable to shocks (either high fixed costs or high debt)
Come the lockdown in March,A sees a sequential decline in profits,from June qtr & Sep qtr, YoY growth slowdown is even more sharper,bfr stabilising in Dec qtr & given low base of Mar 20,Mar 21 qtr YoY surges. Growth for year FY21 is at 17% compared to 20% it achieved pre-covid
Company B has no such luck given its vulnerable biz model,profits half in Mar20 & it swings to losses in June and Sep qtr, bfr finding its feet in Dec qtr & then growing significantly in Mar21. Overall growth for FY21 is at negative 74% compared to 5% growth it achieved pre-covid
To calculate P/E ratio, trailing 4 qtr profits are computed, each time qtrly result comes, the previous year qtr result is dropped and latest one added etc. From a peak combined profit of A+B of 112 in Dec 19, it plummets to 68 in June 20, before sequentially improving thereafter
However, from a trailing 4 qtr combined profit pool, worst number is in Sep-20 (347) and Dec-20 (350), compared to 431 in Dec-19, before coming back to 400 levels in Mar 21, an overall drop of 5% for FY21 for the index, an arguably good achievement given the overall backdrop
Now assuming a flat index level (market cap of 12000),from Dec 19 to Mar 21, this huge swing in TTM EPS of index (even as overall EPS for FY21 is down only 5% compared to FY20), P/E varies from 27.84 in Dec-19 to 34.58 by Sep-20, almost 25% inflation in PE ratio from Dec19 levels
Also, even as worst qtrly print say of June is behind, PE keeps getting revised up as more profitable back qtrs of FY20 get replaced by latest results.Also as one moves to June - Sep 21,reverse impact will be seen as PE ratios shrink as poorer qtr prints keep getting updated!
To sum up, purely focusing on one data point of PE ratio etc for asset allocation may potentially bring in a lot of noise. The above eg is purely a theoretical exercise to explain huge potential swings we will see further in the year in the widely tracked PE ratios.
This is not to justify that markets are cheap or one should throw the PE ratio to bin etc, but to reflect to remove the noise from the signal that this series carries!
& lastly, PE ratio put out by NSE etc which are generally fwded in abundance in most whatsapp/telegram groups are standalone P/E ratios and not consolidated P/E ratios

FIN!
assetmanagement.kotak.com/documents/19/d…

Few of these quirks explained in this note on Kotak Balanced Advantage Fund, which uses valuation and sentiment gauge to arrive at asset allocation

• • •

Missing some Tweet in this thread? You can try to force a refresh
 

Keep Current with Harish Krishnan,CFA

Harish Krishnan,CFA Profile picture

Stay in touch and get notified when new unrolls are available from this author!

Read all threads

This Thread may be Removed Anytime!

PDF

Twitter may remove this content at anytime! Save it as PDF for later use!

Try unrolling a thread yourself!

how to unroll video
  1. Follow @ThreadReaderApp to mention us!

  2. From a Twitter thread mention us with a keyword "unroll"
@threadreaderapp unroll

Practice here first or read more on our help page!

More from @hktg13

Apr 11
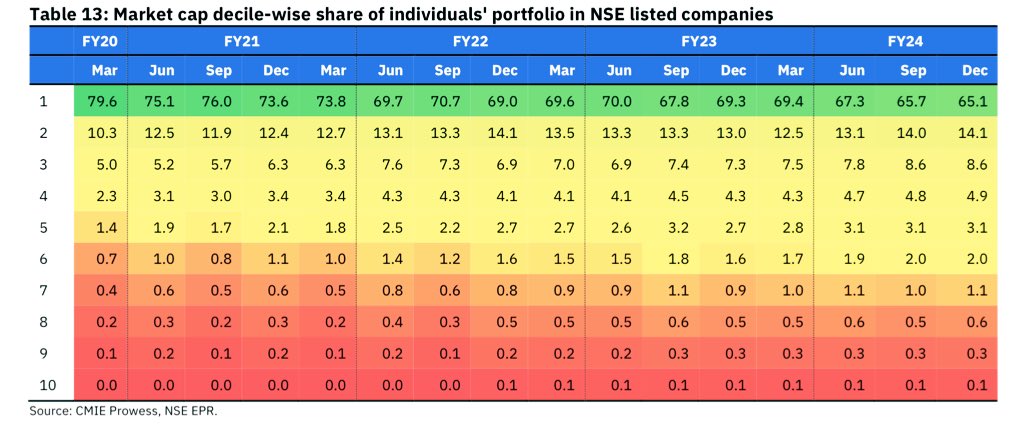
Interesting data point from NSE on different marketcap exposures various categories of investors are exposed to -(each decile is approx 200 companies) Image
.. and how it has progressed in post Covid for individuals, pre Covid the holding was similar to current DMF with 80pct in 1st decile - big shift as investors have embraced the size effect Image
Far lesser seen for DMF and even lesser for FPI in terms of shift down the curve
Image
Image
Read 4 tweets
May 6, 2023
One of the most exhaustive reads on climate change from Indian perspective, on credit, opportunities, challenges, impact on economy, lives n livelihood - RBI recent report on Currency & Finance.

Few charts that caught my eye... steady rise in temperature,more so in last decade Image
...though from a trendline and anomaly pov, rest of world seems to have it worse... ImageImage
Sheer rise in disasters since the 80s, and yet, thanks to use of technology, fatalities have been reducing👍 ImageImage
Read 12 tweets
May 3, 2023
I have been fascinated by this set of companies -"Super-compounders". These are basically companies, where sales of today is equal to profits few years down the line (5 to 10/12 years down the line). I study how rare these extra-ordinary cos (base rates) over 2000-2022...
...how the base rates have moved over time, the key sectors where these super-compounders have been present in (and how they hv changed with time), & how companiess in otherwise "boring" sectors have compounded their profit n revenue pools, often without raising external equity!
Lastly, some insights to valuations, and how even within these rarefied cohort, there are cos which go through bad patches and under-perform markets over last 5 years, and if one evaluates then further n backs these cos during sector headwinds - can be a rewarding experience...🤔
Read 4 tweets
Apr 29, 2023
"Value" or "Growth" style have been debated endlessly, and while each market participant have their own perspective of what constitutes "Value" & "Growth" - an alternative "quant" insight basis historical evidence over last 22 years of Top 200 stocks in India Image
Universe is Top 200 Indian stocks at any point, monthly rebalanced of Top Quintile Equal Weighted long-only portfolios of composite growth & composite value.These are theoretical portfolios with no impact cost,high churn etc,but can help in providing sense on broader style perf
Composite Growth - looks at historical sales growth, historical earnings growth, medium term analyst estimates and longer term earnings growth.

Composite factor - looks at book to price, sales to price, cash flow to price and trailing and forward earnings yield
Read 11 tweets
Apr 14, 2023
Value accretion of companies over time generally translates to returns to investors,but many a times the difference is so stark that almost all phenomenal gains in market cap of underlying doesn't translate to investor returns-even in a buy & hold strategy!(So not behavioral gap)
Case in point China, where returns to investors over 30 years is 0, even though country grew rapidly and so did country's market capitalisation...
What explains this huge divergence of marketcap & index returns - constant equity dilution to fund growth, which dilutes existing shareholder as well constant changes in index composition (changing rules - like bringing tech in Hang Seng post covid etc, or frequent churns)
Read 20 tweets
Dec 28, 2022
Follow up post on how returns were made in equity markets as various countries transited the milestones from 500bn$ onwards... Image
Returns in US (period from 1959, when it crossed 500bn$ to 1991, when it crossed 6tn$). Broadly, returns have improved as US moved from 3 to 6tn$, giving good double digit returns.
I have given CAGR of average price in start and end year (in local currency as well as in $ terms), along with range of returns to someone who got it at lowest/highest at starting year and exited at best/worst price in ending year.
Read 10 tweets

Did Thread Reader help you today?

Support us! We are indie developers!


This site is made by just two indie developers on a laptop doing marketing, support and development! Read more about the story.

Become a Premium Member ($3/month or $30/year) and get exclusive features!

Become Premium

Don't want to be a Premium member but still want to support us?

Make a small donation by buying us coffee ($5) or help with server cost ($10)

Donate via Paypal

Or Donate anonymously using crypto!

Ethereum

0xfe58350B80634f60Fa6Dc149a72b4DFbc17D341E copy

Bitcoin

3ATGMxNzCUFzxpMCHL5sWSt4DVtS8UqXpi copy

Thank you for your support!

Follow Us!

:(