
Investing from 1st principles. These are my personal views & may not necessarily represent the views of my organisation - ABSL AMC
 Aggregate market cap of these deciles was 2lakh cr in June 21, which is now 13 lakh crore - close to 6x growth in overall market values in 3+ years
 FY24 snapshot of capital efficiency metrics for these segment, earnings hv more than doubled FRM pre Covid levels & presumably FY24 metrics data have benefit of rising tide across segments (these are not cyclically low numbers, & if at all, these tend to overstate base rates)
 .. and how it has progressed in post Covid for individuals, pre Covid the holding was similar to current DMF with 80pct in 1st decile - big shift as investors have embraced the size effect
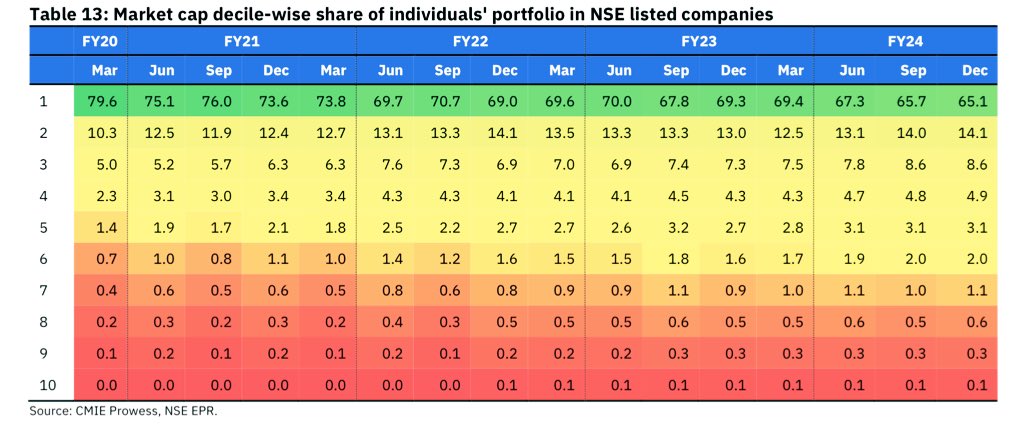
 ...though from a trendline and anomaly pov, rest of world seems to have it worse...

 Universe is Top 200 Indian stocks at any point, monthly rebalanced of Top Quintile Equal Weighted long-only portfolios of composite growth & composite value.These are theoretical portfolios with no impact cost,high churn etc,but can help in providing sense on broader style perf

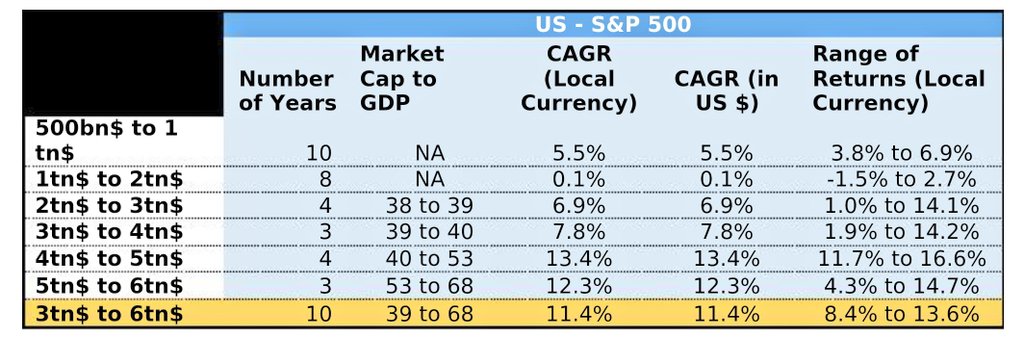 Returns in US (period from 1959, when it crossed 500bn$ to 1991, when it crossed 6tn$). Broadly, returns have improved as US moved from 3 to 6tn$, giving good double digit returns.
 While it is anyone's guess if these projections for India will hold true,few intrstg points
 Puzzled that two sectors of inland transportation and restaurant & hotels are sectors where digital linkages hv declined over time (given the uber/ola/Zomato/swiggy) as some areas which mainstreamed during this period🤔

 India is small drop in ocean of financial markets - 3% of world market cap share,& even within EM,its share in MSCI has been 7-8% till the recent surge to 12%.Despite being such a small fraction of EM,cumulative flows hv been large positive all through n more than all EM-ex India
 While returns have been anaemic, what is incredible is the drawdown chart of MSCI China over these 30 years! Almost every year a 40 to 50% drawdown in index with nothing much to show in terms of returns over so long a period...phew!
 Without passing any judgement on the "suitability" of such companies to be in indices etc, think it is important to see if valuation ratio (say P/E) can dramatically change due to such changes, and more importantly the need to look under the hood than just rely on headline ratios
 Price to sale>10x is just one number, thr is no 'lakshman rekha' tht it can't be crossed etc,but across cycles and multiple markets, price to sales>10x has been a barometer of high valuations.(Over simplified by Sun Microsystems CEO-Scott Mcnealy in interview post dotcom crash)
 First, overall energy mix over the last few decades has shown a shift towards electricity compared to oil based energy. Needless to say, our sources of electricity are more local (coal, renewable) while oil/gas is primarily hostage to world prices n vagaries of world supplies
 -10% RoE itself is reasonably low threshold, so gives a sense of odds of identifying franchises tht accrete value over time
 Above chart from Citi, on YoY profit growth in various regions for June qtr. For India from June 2020, profits hv more than doubled (base qtr impacted by Covid almost everywhere).

 While energy efficiency has improved across the board, the shape of fall in Indian energy intensity, despite such relative poor per capita consumption n incomes is staggering. Barring a few years, india energy intensity is lower than even US across the last 30 years!
 US S&P500 (ex fin) capex to sales has also been in a narrow band of 6-7% (post dotcom bust), however proportion of spends on R& D hv gone up materially. For eg, Apple Inc has taken R&D to sales from 2%(2011) to 8% (2020)
 Are bond mkts signalling tht recovery ahead will be even more anaemic than previous decade (this cycle so far topping at 150bps as against 300 bps usually)? More imp,in the last few sessions, US2/10 has fallen below 100bps.Are we in for a muddle-through economy in decade ahead?