
I recently published "Ten Guidelines for Better Tables" in the Journal of Benefit Cost Analysis (@benefitcost) on ways to improve your data tables.
Here's a thread summarizing the 10 guidelines.
Full paper is here: cambridge.org/core/journals/…
Here's a thread summarizing the 10 guidelines.
Full paper is here: cambridge.org/core/journals/…
Before we get to the ten guidelines, recognize that just like in graphs and charts, there are a lot of pieces to tables. And, just like graphs and charts, we can control the look and design of all of these elements.

Rule 1. Offset the Heads from the Body
Make your column titles clear. Try using boldface type or lines to offset them from the numbers and text in the body of the table.
Make your column titles clear. Try using boldface type or lines to offset them from the numbers and text in the body of the table.


Rule 2. Use Subtle Dividers Rather Than Heavy Gridlines
Lighten or even remove many of the heavy borders and dividers in your tables. Every single cell border is rarely necessary.
Lighten or even remove many of the heavy borders and dividers in your tables. Every single cell border is rarely necessary.


Rule 3. Right-Align Numbers and Heads
Right-align numbers along the decimal place or comma. We might need to add zeros to maintain the alignment, but it’s worth it so the numbers are easier to read and scan.
Right-align numbers along the decimal place or comma. We might need to add zeros to maintain the alignment, but it’s worth it so the numbers are easier to read and scan.

Rule 4. Left-Align Text and Heads
Once we’ve right-aligned the numbers, we should left-align the text. Notice how much easier it is to read the country names in the far-right column than in the other two columns.
Once we’ve right-aligned the numbers, we should left-align the text. Notice how much easier it is to read the country names in the far-right column than in the other two columns.

Rule 5. Select the Appropriate Level of Precision
Precision to the fifth decimal place is rarely necessary. Consider a balance between necessary precision and a clean, spare table.
Precision to the fifth decimal place is rarely necessary. Consider a balance between necessary precision and a clean, spare table.

Rule 6. Guide Your Reader with Space between Rows and Columns
Your use of space in and around the table can influence the order in which someone reads the data. Use spacing strategically to match the order you want your reader to take in the table.
Your use of space in and around the table can influence the order in which someone reads the data. Use spacing strategically to match the order you want your reader to take in the table.


Rule 7. Remove Unit Repetition
Our reader knows that the values in the table are dollars because we told them in the title or subtitle. Repeating the symbol throughout the table is overkill and adds clutter.
Our reader knows that the values in the table are dollars because we told them in the title or subtitle. Repeating the symbol throughout the table is overkill and adds clutter.


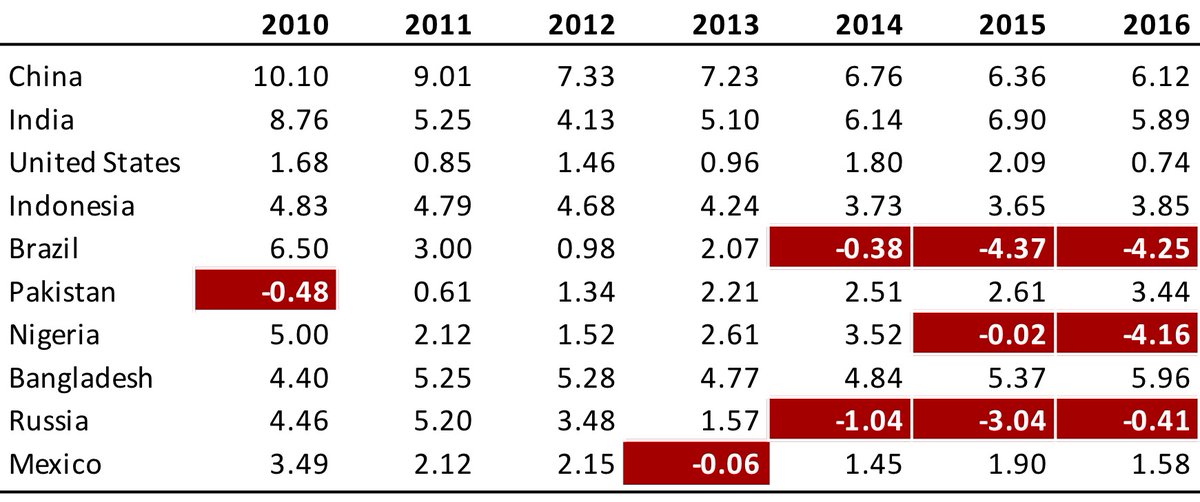
Rule 8. Highlight Outliers
Some readers will wade through all of the numbers in the table because they need specific information, but many readers likely only need the most important values.
Some readers will wade through all of the numbers in the table because they need specific information, but many readers likely only need the most important values.

Rule 9. Group Similar Data and Increase White Space
Reduce repetition by grouping similar data or labels. Similar to eliminating dollar signs on every number value, we can reduce some of the clutter in our tables by grouping like terms or labels.
Reduce repetition by grouping similar data or labels. Similar to eliminating dollar signs on every number value, we can reduce some of the clutter in our tables by grouping like terms or labels.

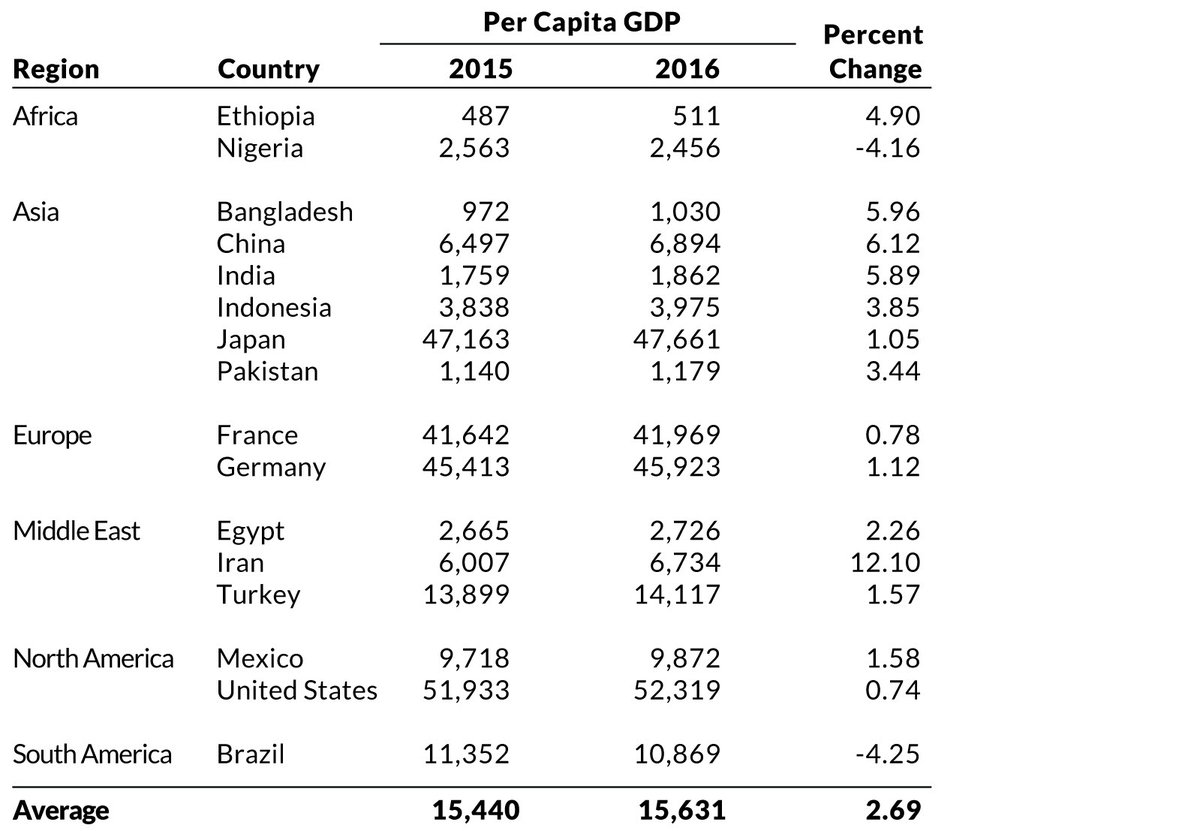
Rule 10. Add Visualizations When Appropriate
We can make larger changes to our tables by adding small visualizations, which can make it easier to for the reader to navigate and find patterns and trends you want to highlight.
We can make larger changes to our tables by adding small visualizations, which can make it easier to for the reader to navigate and find patterns and trends you want to highlight.


There are several examples in the full paper, but here’s one example of how organize, declutter, simplify, and add visualizations to a table. Thanks to Masterman and Viscusi (2018) for giving me permission to redesign their table.


Thanks are also due to the various JBCA authors who granted me permission to use their work in the article. And kudos are due to Stephen Few and @dhanalytics for inspiration.
You can learn more about better table design in the full article and a longer treatment in my forthcoming book, 'Better Data Visualizations: A Guide for Researchers, Scholars, and Wonks.' | amzn.to/2zHQ4qv|
/end of the thread
/end of the thread

