Jon Schwabish Profile picture
📈Economist & DataViz 🕸@urbaninstitute @PolicyViz 🎙PolicyViz Podcast 📺YouTube step-by-step tutorials 🗞On Substack: https://jschwabish.subst 👀All views mine
Jan 24, 2023 20 tweets 7 min read
So, in case you've been wondering what's going on with me and why you are seeing the following image on my PolicyViz website, I thought I'd tell you a little story. 🧵 Picture of a dark sky with mountains with the word PolicyViz This past weekend, my family and I flew to Arizona for my aunt's funeral. She passed in summer 2020 from breast cancer and we couldn't do the funeral during COVID (you can see this picture of her holding me in the dedication to my book). Woman with long dark hair holding a baby
Jan 24, 2023 8 tweets 4 min read
This dual axis chart is indeed misleading. Placing 5 countries on the left axis and the US on a different right axis makes it look like US military spending lags China in the last few years, which is far from the case. What are some possible alternatives? A 🧵 #1. First off, just plot all the lines on the same graph! Honestly, yes the US is an outlier, but not so much that you can't see the other countries. Line chart with the title "Top Six Countries with the H
Aug 30, 2021 9 tweets 3 min read
Quick thread on data visualization contests.

I recognize that dataviz contests can be attractive to some. I entered a bunch when I was first starting and it gave me a chance to practice and potentially get some visibility and money.

But they are also potentially problematic. Dataviz contests have the potential to act as "spec" work, to ask (usually young) people to create something that the organizing offerer will end up using in their own work.

For example, I find this new one from RMDS concerning: grmds.org/Q3/Comp
Aug 3, 2020 15 tweets 8 min read
I recently published "Ten Guidelines for Better Tables" in the Journal of Benefit Cost Analysis (@benefitcost) on ways to improve your data tables.

Here's a thread summarizing the 10 guidelines.

Full paper is here: cambridge.org/core/journals/… 
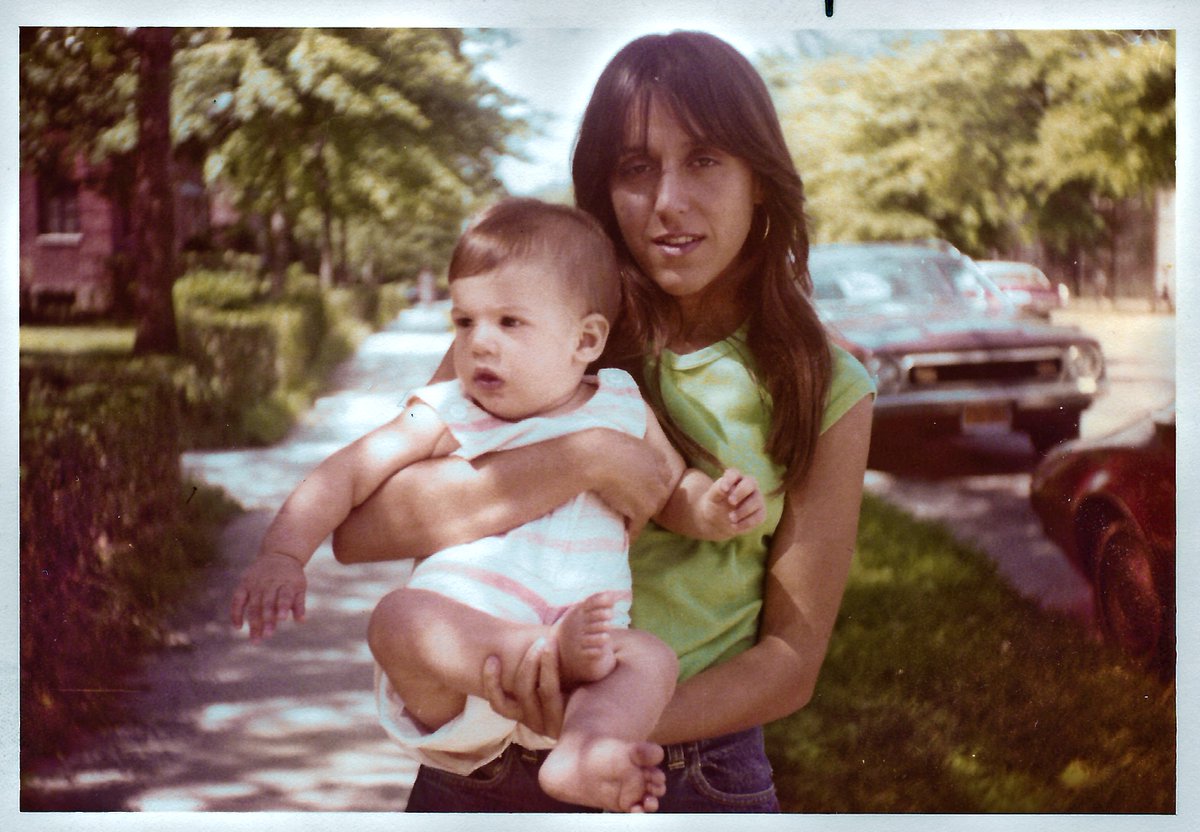
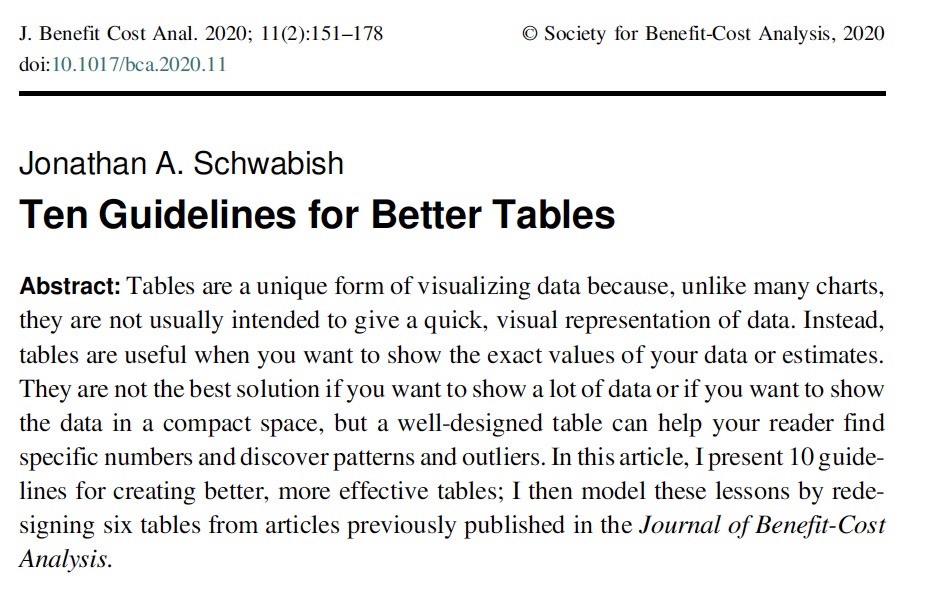
Before we get to the ten guidelines, recognize that just like in graphs and charts, there are a lot of pieces to tables. And, just like graphs and charts, we can control the look and design of all of these elements.
Jun 1, 2020 14 tweets 4 min read
The @uscensusbureau’s has started releasing results from its new, weekly, Pulse survey. It includes some great data, but we need to be careful in how we use & interpret the results. Here’s a thread (with thanks to my @urbaninstitute colleagues @_Rob_Santos & Doug Wissoker) Some background: The Pulse survey “is designed to quickly and efficiently deploy data collected on how people’s lives have been impacted by the COVID-19 pandemic.” Data collection began 4/23/2020 and is expected to last for 90 days. | census.gov/programs-surve…
Aug 23, 2019 15 tweets 12 min read
THREAD. I shy away from posting overtly political or religious messages on my Twitter feed. This week, however, is leading me to rethink that approach, and I want to share some of my feelings and thoughts about the actions of some our elected officials. Excuse me if I ramble. For those who don't know, I am a Jewish American. I would not say I am an overly religious person, but my Judaism has helped shaped the person I am today, both with respect to my faith, and also politically and culturally.