It's #JobsDay.
In Mar+Apr, we lost 22 million jobs in tight lockdown.
In May+June, gained back about 33% of those, putting us at about 10% fewer jobs than Feb.
In Mar+Apr, we lost 22 million jobs in tight lockdown.
In May+June, gained back about 33% of those, putting us at about 10% fewer jobs than Feb.

Will today's report show continued recovery, slowing, stall, or reversal? Signals mixed but job change almost certainly slower than last month.
https://twitter.com/aaronsojourner/status/1283568261708296194
Pay more attention to employment-to-population ratio than unemployment rate.
Margin between employed & not is more meaningful these days than between (no job & searching for job) vs (no job & not searching).
We are below the record of 72 years prior to April
Margin between employed & not is more meaningful these days than between (no job & searching for job) vs (no job & not searching).
We are below the record of 72 years prior to April

Also big positive seasonal adjustment (~+1m). Usually schools have big layoffs this month but they already happened, will make picture brighter than last month's experience.
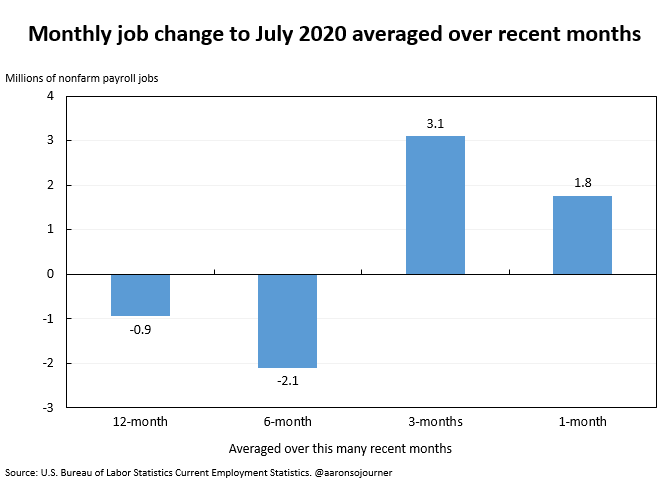
Added 1.8 million jobs from mid-June to mid-July. Solid but a huge deceleration from 4.8 million the prior month or 2.7 million two months ago.
Means we recovered 42% of the 22.2 jobs lost in Mar+April. Still 12.9 million jobs (8.4%) down from Feb.
Means we recovered 42% of the 22.2 jobs lost in Mar+April. Still 12.9 million jobs (8.4%) down from Feb.
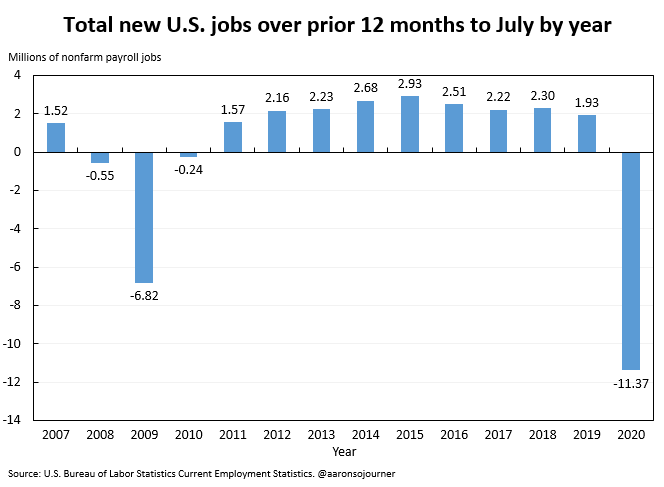
Over the last 12 months, we've lost 11.37 million jobs.
Compare that to losses in the Great Recession.
Compare that to losses in the Great Recession.

The share of adults employed is up 0.5 percentage points to 51.1%. Another deceleration of improvement but progress.
This is historically low. Before April, the share hadn't been that low since July 1955, 66 years ago.
This is historically low. Before April, the share hadn't been that low since July 1955, 66 years ago.

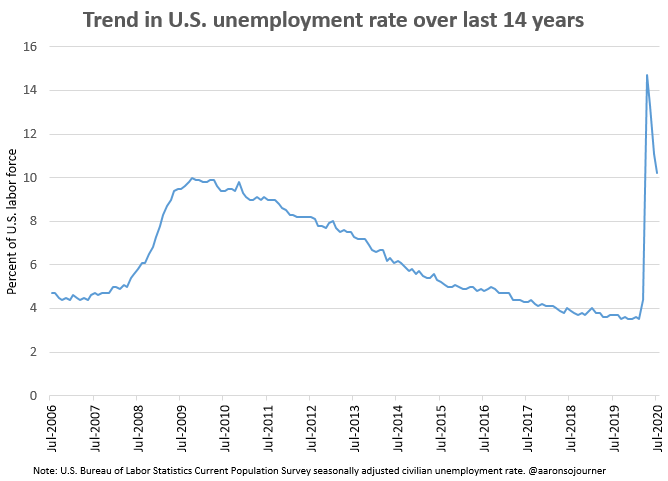
The unemployment rate fell 0.9 percentage points to 10.2%, again progress but still awfully high.
We have now spent 4 months above the Great Recession's highest level, 10.0%, where it was for 1 month.
We have now spent 4 months above the Great Recession's highest level, 10.0%, where it was for 1 month.

BLS describes how education sector layoffs occurred unusually early this year but seasonal adjustment (SA) makes today's report rosier than on-the-ground reality (& made earlier months look worse). 

+1.8 million top-line estimate of jobs growth = 591K jobs before SA+1.172m SA.
SA turned govt job change from negative to positive. For state & for local.
State & local govt jobs continued to fall but less than in usual years due unusually many layoffs in recent months.
SA turned govt job change from negative to positive. For state & for local.
State & local govt jobs continued to fall but less than in usual years due unusually many layoffs in recent months.
In sum, labor market recovery continuing but slowing and remains very incomplete. We have 8.4% (12.9 million) jobs fewer than in Feb.
More than half of American families report their household that lost employment income since March, per Census #HouseholdPulseSurvey.
More than half of American families report their household that lost employment income since March, per Census #HouseholdPulseSurvey.
Last thing. @BLS_gov does amazing work to create timely, accurate info about America's working families, a huge public good.
They are there for us, even now, & we need to show up for them.
If you are a labor economist or care about workers & employment, join @Friends_of_BLS.
They are there for us, even now, & we need to show up for them.
If you are a labor economist or care about workers & employment, join @Friends_of_BLS.
• • •
Missing some Tweet in this thread? You can try to
force a refresh


