Glen Peters Profile picture
Aug 10, 2020 10 tweets 5 min read Read on X
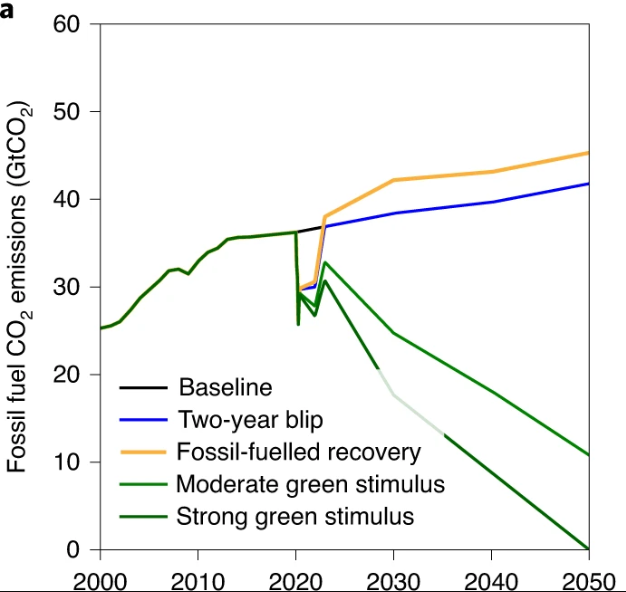
"[a]n economic recovery tilted towards green stimulus and reductions in fossil fuel investments, it is possible to avoid future warming of 0.3 °C by 2050."

(thread)

nature.com/articles/s4155… ImageImage
I do have a few problems with this framing...

The use of the word "tilted" implies are rather minor shift, but the "strong green stimulus" is actually a ~1.5°C pathway ("moderate" is a ~2°C pathway).

I thought 1.5°C required a transformation? Did #SR15 get it wrong?

2/ Image
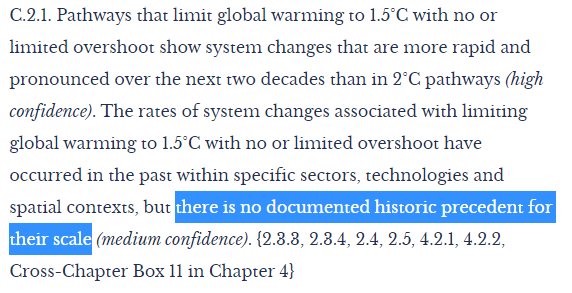
#SR15: "Pathways limiting global warming to 1.5°C with no or limited overshoot would require rapid and far-reaching transitions in energy, land, urban and infrastructure (including transport and buildings), and industrial systems (high confidence)"

ipcc.ch/sr15/chapter/s…

3/ ImageImage
Is this the message for governments: "with an economic recovery tilted towards green stimulus and reductions in fossil fuel investments"?

Just green your stimulus a bit, & 1.5°C is done & dusted? I think that downplays the challenge somewhat?

(@piersforster?)

4/
Another issue I have with the framing is that I would think of "recovery" as being a short-burst (maximum a few years) of investment to achieve whatever objective ("recovery").

But, these "green stimulus" pathways are continuous investments to 2050. This is permanent change!

5/ Image
Of course, we want permanent change, but I don't think this meshes so well with the term "recovery".

If I recover from being sick, does that mean I spend the rest of my life in intensive care?

I need to change my diet/lifestyle, permanently, not recover & return to normal?

6/
Current pledges put us on a path for 1.8°C or so in 2050, & if we follow a 1.5°C pathway, we shave off 0.3°C. This is still 0.3°C higher than where we are today (~1.2°C).

I think this is an important point to focus on, but the challenge is communicating these changes.

7/ Image
The climate is a slow moving system, so deep mitigation (purple in top figure) leads to small & delayed changes in the temperature response (bottom figure).

This is my attempt to communicate the challenge, based on the SSP database (of course, too complex for lay audiences).

8/ Image
Noting that the authors based the reference pathway on where we are heading (as opposed to the worst case RCP85-type pathway). This is the correct approach!

Using a RCP85-type pathway as a reference would make the benefits of mitigation ≫0.3°C...

nature.com/articles/d4158…

9/ Image
Overall, a good & useful study (thanks @piersforster & team).

I just got thrown by the "tilted" term & "strong green stimulus" meaning ~1.5°C pathway. I am interested how other people interpreted this? Thoughts?

10/10

• • •

Missing some Tweet in this thread? You can try to force a refresh
 

Keep Current with Glen Peters

Glen Peters Profile picture

Stay in touch and get notified when new unrolls are available from this author!

Read all threads

This Thread may be Removed Anytime!

PDF

Twitter may remove this content at anytime! Save it as PDF for later use!

Try unrolling a thread yourself!

how to unroll video
  1. Follow @ThreadReaderApp to mention us!

  2. From a Twitter thread mention us with a keyword "unroll"
@threadreaderapp unroll

Practice here first or read more on our help page!

More from @Peters_Glen

Apr 12
There is a very strong linear relationship between atmospheric CO2 (concentration) and cumulative CO2 emissions.

In the last days, quite a few have been commenting there are feedbacks kicking in.

A thread...

1/ Image
If atmospheric CO2 is proportional to cumulative CO2 emissions, then the annual change in atmospheric CO2 is proportional to annual CO2 emissions.

The ratio of the two is the 'airborne fraction', which is rather constant. Maybe a slight increase in trend lately, maybe...

2/ Image
Since emissions have leveled out in the last decade, one would expect therefore that the atmospheric increase has leveled out.

The concentration data is noisy, and it has leveled out or not depending on how it is smoothed! (look at last 10 years).

3/ Image
Read 8 tweets
Apr 9
Is the atmospheric growth rate of CO2 slowing down?

Total CO2 emissions have gone from 2%/yr growth (2000s) to 0%/yr (2010s).

Do we see that change in the atmosphere?

It is hard to answer 🧵


1/ rdcu.be/buifD
Image
I can make this figure incredibly complex by adjusting for ENSO (red dots and line).

We know the response of atmospheric CO2 to El Niño is lagged. This figure shows a 9 month lag, as used by Betts & Jones in their projection

But, 2023 is a La Niña?

2/ metoffice.gov.uk/research/clima…
Image
The same figure with a three month lag says 2023 is a El Niño.

In either case, adjusting the growth rate for ENSO makes it look like the atmospheric CO2 growth rate is maintained, and not slowing down.

This is worrying. It should be slowing down...

3/ Image
Read 8 tweets
Dec 15, 2023
One of the key arguments that Norway uses to continue oil & gas developments, is that under BAU it is expected that oil & gas production will decline in line with <2°C scenarios, even with continued investment.

Let's look closer at these projections & reality...

1/ Image
Here is the projections from the 2003 report from the petroleum agency.

In reality (tweet 1) there was a dip around 2010, but production is now up around 250 million cubic again.

The forecast was totally & utterly WRONG!

2/ Image
In 2011 there was a forecast for an increase in production to 2020, but then a decline. This is probably since they started to put the Johan Sverdrup field on the books.

The increase in production was way too low, again, they got it wrong.

3/ Image
Read 9 tweets
Dec 5, 2023
📢Global Carbon Budget 2023📢

Despite record growth in clean energy, global fossil CO2 emissions are expected to grow 1.1% [0-2.1%] in 2023.

Strong policies are needed to ensure fossil fuels decline as clean energy grows!


1/ essd.copernicus.org/articles/15/53…
Image
CO2 emissions by fossil fuel:
* We thought coal peaked in 2014. No, & up another 1.1% in 2023
* Oil up 1.5%, on the back of a 28% increase in international aviation & China, but oil remains below 2019 level. 🤞
* Has the golden age of gas come to an end thanks to Russia?

2/ Image
By top emitters:
* China up 4.0% & a peak this year would be a surprise
*US down 3.0%, with coal at 1903 levels
* India up 8.2%, with fossil CO2 clearly above the EU27
* EU27, down 7.4% with drops in all fuels
* Bunkers, up 11.9% due to exploding international aviation

3/ Image
Read 11 tweets
Nov 3, 2023
Is the new @DrJamesEHansen et al article an outlier, or rather mainstream?

At least in terms of the key headline numbers, it seems rather mainstream, particularly if you remember most headline key numbers have quite some uncertainty!


🧵1/ academic.oup.com/oocc/article/3…
Image
Equilibrium Climate Sensitivity of 4.8°C ± 1.2°C

IPCC best estimate 3°C
IPCC likely range: 2.5-4°C
IPCC very likely range: 2-5°C

Sure, Hansen et al are in the high end, but so are many others.

More details:

2/
Image
"...global warming will exceed 1.5°C in the 2020s & 2°C before 2050"

Here is the global warming from "Current Policies" in IPCC AR6 WGIII. Sorry folks, but Hansen is actually conservative.

Also, cast your eyes to 2020-2030: WARMING ACCELERATES

3/ Image
Read 7 tweets
Oct 31, 2023
The Remaining Carbon Budget for 1.5°C is now smaller because:
1) We have not reduced emissions in three years
2) Updated simple climate models because of updated historical aerosol emissions
3) Some new method choices


1/ nature.com/articles/s4155…
Image
The update for 2°C has similar changes for each component, but because the budget is much bigger, the changes don't seem that dramatic. Not Nature Climate Change worthy...

The changes to the 1.5°C budget seem dramatic, because the budget is basically gone.

2/ Image
These updates are not new. A few years back 1.5°C was considered "geophysically impossible", but not after a revised budget:


I wrote a post on the utility of 1.5°C budgets back then, obviously ignored. Also on non-CO2.


3/ nature.com/articles/ngeo3…
rdcu.be/0Tiv
Image
Read 5 tweets

Did Thread Reader help you today?

Support us! We are indie developers!


This site is made by just two indie developers on a laptop doing marketing, support and development! Read more about the story.

Become a Premium Member ($3/month or $30/year) and get exclusive features!

Become Premium

Don't want to be a Premium member but still want to support us?

Make a small donation by buying us coffee ($5) or help with server cost ($10)

Donate via Paypal

Or Donate anonymously using crypto!

Ethereum

0xfe58350B80634f60Fa6Dc149a72b4DFbc17D341E copy

Bitcoin

3ATGMxNzCUFzxpMCHL5sWSt4DVtS8UqXpi copy

Thank you for your support!

Follow Us!

:(