While @GlacierThwaites fieldwork is postponed for the coming Antarctic summer, how much ongoing ice loss is there from #ThwaitesGlacier and nearby glaciers in the Amundsen Sea, and how big is their contribution to sea-level rise? Thread, 1/23
3 separate recent studies provide measurements for individual glaciers or drainage basins based on satellite remote sensing observations:
Rignot et al. (2019) doi.org/10.1073/pnas.1…
Shepherd et al. (2019) doi.org/10.1029/2019GL…
Smith et al. (2020) doi.org/10.1126/scienc…
2/23
Rignot et al. (2019) doi.org/10.1073/pnas.1…
Shepherd et al. (2019) doi.org/10.1029/2019GL…
Smith et al. (2020) doi.org/10.1126/scienc…
2/23
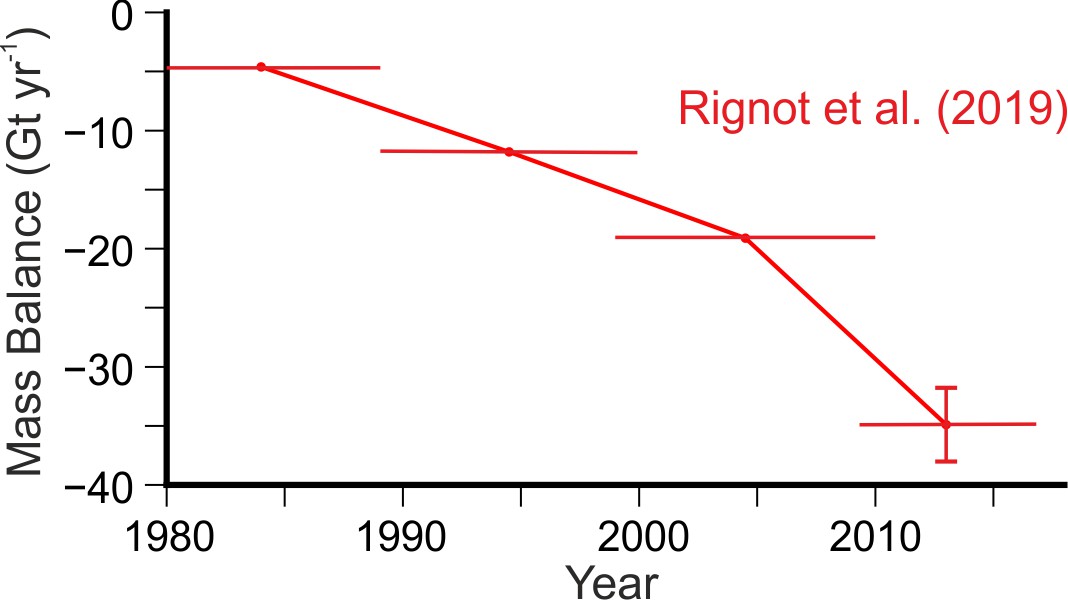
In summary, the results of these studies show rates of net ice mass loss from Thwaites and nearby glaciers are now more than six times what they were 30 years ago. This graph shows the progressive increase in net ice loss from Thwaites from the results of Rignot et al. 3/23 
The total ice losses from Thwaites, Pine Island and nearby glaciers flowing into the Amundsen Sea now account for 10% of the current rate at global mean sea-level rise. 4/23
The current contribution of these glaciers still only adds one third of a mm to mean sea-level each year, but if the trend of increasing ice loss observed over the past 30 years continues it will affect predictions of sea-level rise by the end of the century significantly. 5/23
The most recent results for the amount of ice lost each year are still mind boggling. The three studies put the combined net annual ice loss from Pine Island, Thwaites, Haynes and the catchments of the Crosson and Dotson ice shelves at between 131 and 146 gigatons/year. 6/23
To give those numbers some context, 1 gigaton of water spread over the area inside the M25 (i.e. Greater London plus) would be enough to form a layer 43 cm deep, so 131 gigatons equates to a 56 m-thick layer over this area. 7/23

To put it another way, the bowl of Wembley Stadium has a volume of 4 million m³ beneath the roof, so 1 gigaton (~1 km³) of water would fill it 250 times over. Therefore, the melt from ice being lost from Amundsen Sea glaciers would fill Wembley to the roof within 15 minutes. 8/23

Before going into more detail, note that each of the 3 studies compares differences between observations made many years apart to determine average annual rates of change. Therefore even the most recent rates of change quoted are probably already out of date. 9/23
In the study by Rignot et al. the ice losses from different glaciers in the region are classified most finely, with the losses from Haynes Glacier and the catchments of the Crosson and Dotson ice shelves that lie to the west of Thwaites being itemised separately. 10/23
This study calculates ice losses by the 'component', or 'input-output' method, comparing gains from snowfall over individual glaciers with losses calculated from flow speed and thickness of ice crossing the grounding line, where the glaciers flow out over the sea. 11/23
Rignot et al. calculate that net ice mass loss from Thwaites Glacier between 2009 and 2017 averaged 34.9 Gt/yr, while the Haynes, Crosson and Dotson catchments combined lost another 38.6 Gt/yr and Pine Island Glacier lost 60.7 Gt/yr. 12/23
Estimates from the same study of net ice mass losses during the 1980s are just 4.6 Gt/yr from Thwaites Glacier, 7.9 Gt/yr from Haynes, Crosson and Dotson, and 7.7 Gt/yr from Pine Island Glacier. 13/23
In the other two studies Thwaites Glacier is included together with the Haynes, Crosson and Dotson catchments in an ice drainage area referred to as 'Basin 21'. Both studies use satellite altimetry data, measuring changes in surface elevation of the glaciers over time. 14/23
The Shepherd et al. study uses radar altimetry, available since 1992, thus allowing long-term trends to be examined. Their results indicate net ice mass loss from Basin 21 averaged 76 Gt/yr between 2012 and 2017, while Pine Island Glacier (Basin 22) lost another 55 Gt/yr. 15/23
Estimates from the same study of net ice mass losses between 1992 and 1997 are just 12 Gt/yr from Basin 21 (Thwaites, Haynes, Crosson and Dotson) and 2 Gt/yr from Pine Island Glacier. 16/23
The Smith et al. study uses laser altimetry, which has advantages compared to radar in that there is minimal subsurface signal penetration and the capability for accurate measurements on the steeper sloping ice sheet margins. 17/23
The results from the Smith et al. study indicate that net ice mass loss from Basin 21 (Thwaites ++) averaged 83 Gt/yr between 2003 and 2019, while Pine Island Glacier lost another 63 Gt/yr. 18/23
Rignot et al's results indicate Thwaites Glacier alone accounted for 47% of net ice mass loss from Basin 21 between 2009 and 2017. If we apply that % to the results of the other 2 studies this gives 36 Gt/yr (Shepherd et al.) and 39 Gt/yr (Smith et al.) from Thwaites alone. 19/23
So results from the 3 studies using different methods are remarkably consistent. If we can tell so much about how Thwaites Glacier is changing from remote sensing, why do we need the @GlacierThwaites collaboration to send field parties and ships there to study it locally? 20/23
The answer is that in order to make better predictions of how much and how fast it will change in the future we need to understand the processes that are taking place there, for example ... 21/23
how warm water reaches the glacier front, how water flows and mixes under the ice shelf, how character of the glacier bed and margins influence its flow, the effects of changes in ice shelf pinning and extent, and how the glacier has responded to past changes in forcing. 22/23
Finally, I want to emphasize that I'm not a remote sensing expert, so if anyone who is spots any errors in the above thread please let me know and I'll try to set the record straight. 23/23