
A thread listing some of the sources of info, video clips and animations I included in my talk on The Polar Oceans at the outreach event following on from @BSRG19 earlier this week. Thanks to @FJavierHernnde2 for this photo and for organizing the event. 1/n 
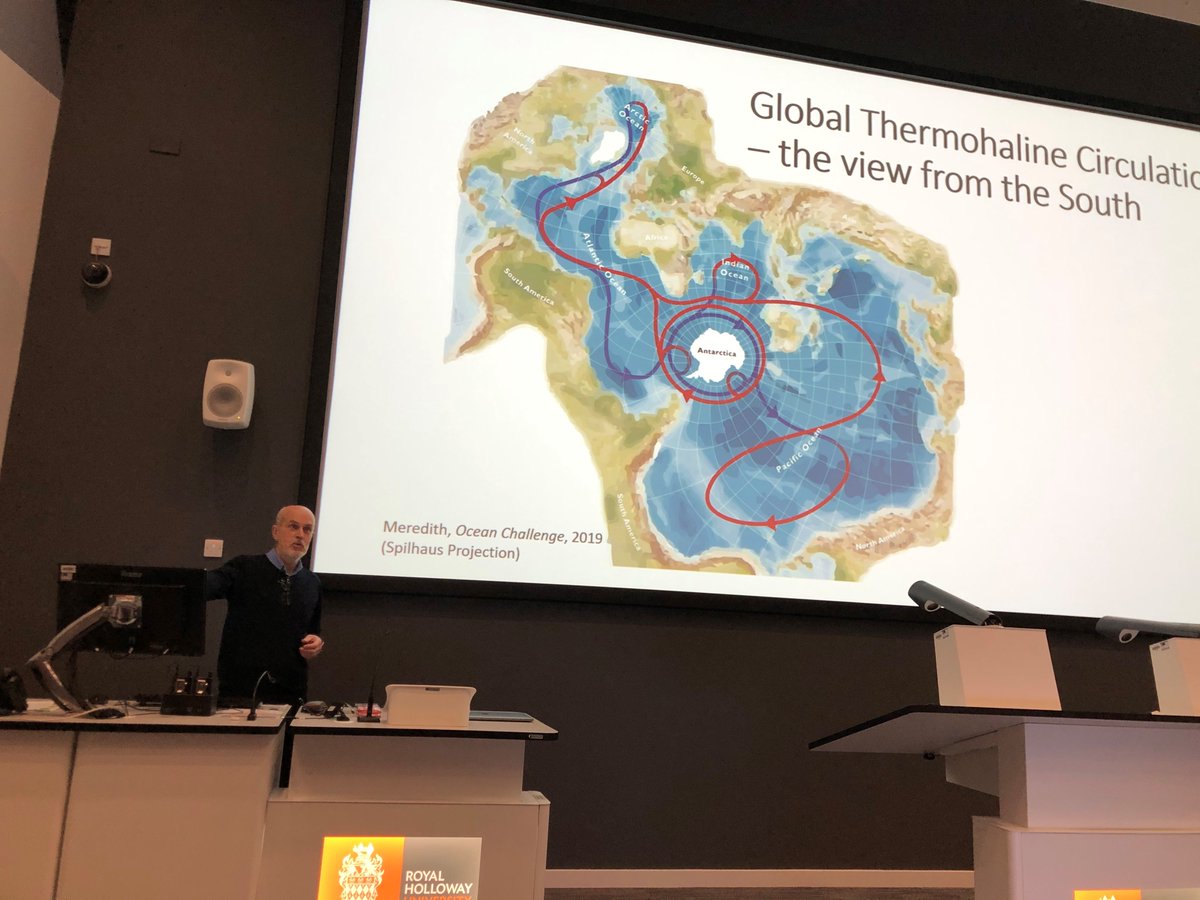
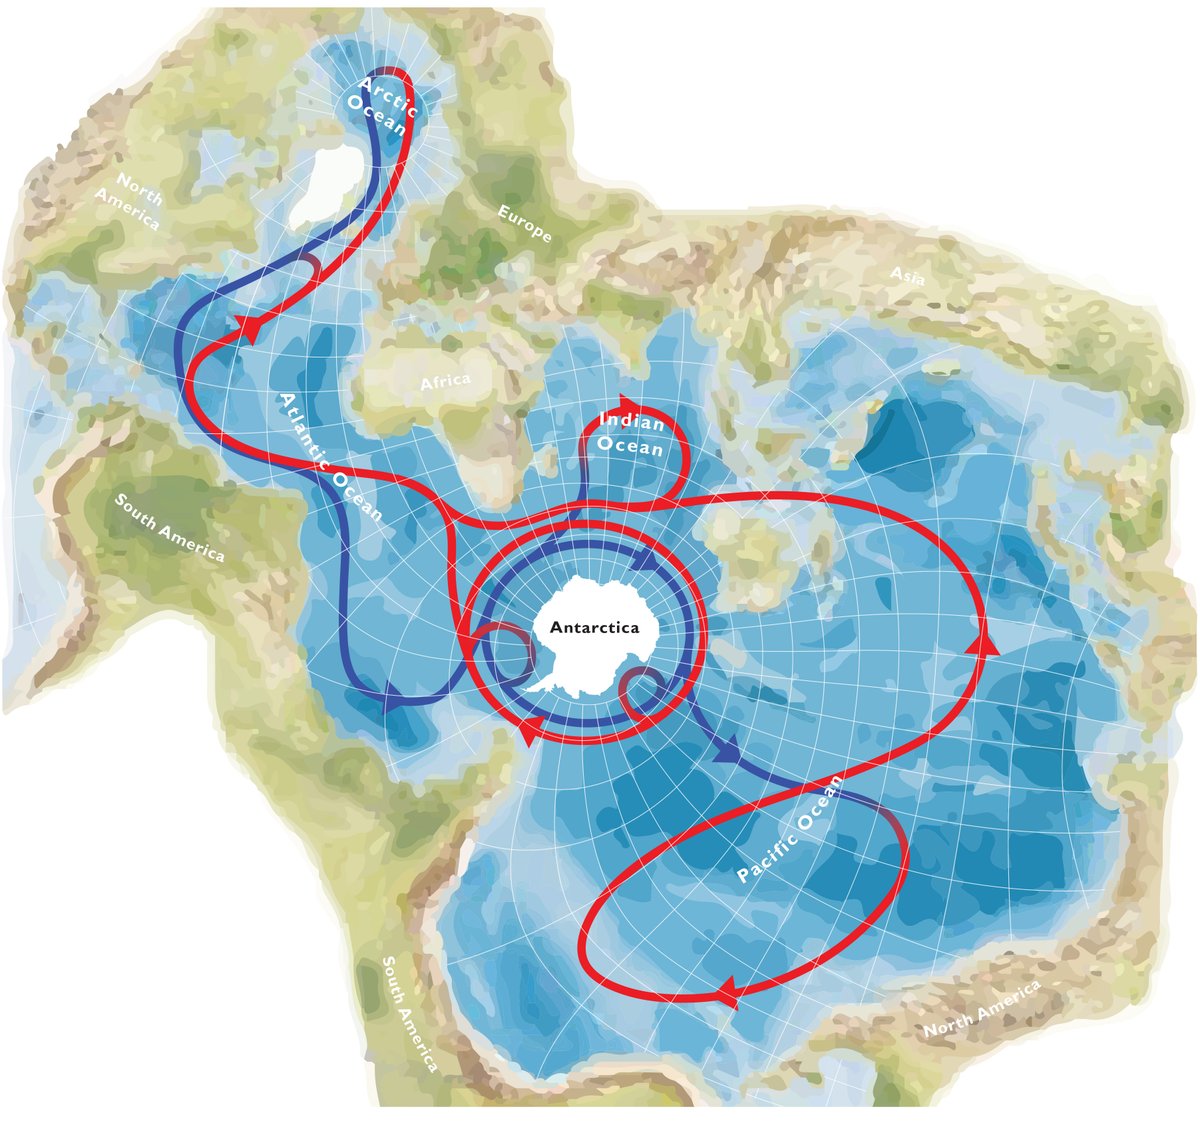
This figure, as seen in the previous tweet, shows an Antarctic-centred view of the global thermohaline circulation system from a recent article by @meredith_mmm challenger-society.org.uk/oceanchallenge…. It highlights how the Southern Ocean connects the other major oceans. 2/n
To further illustrate the thermohaline circulation I showed an animation by Greg Shirah of @NASAViz , which can be found at svs.gsfc.nasa.gov/3658. 3/n
To illustrate what conditions can be like in the Southern Ocean I showed a clip from a film made by @RemoteLongitude about RV Polarstern expedition PS104 in 2017, which can be found at youtube.com/watch?v=qV78Kr…. The clip I showed is 7:40 – 8:10 into the film. 4/n
To illustrate how dense water produced by brine rejection during sea ice formation sinks through the underlying water I showed this clip entitled ‘finger of death’ from the @BBCEarth Frozen Planet series - bbc.co.uk/programmes/p00…. 5/n
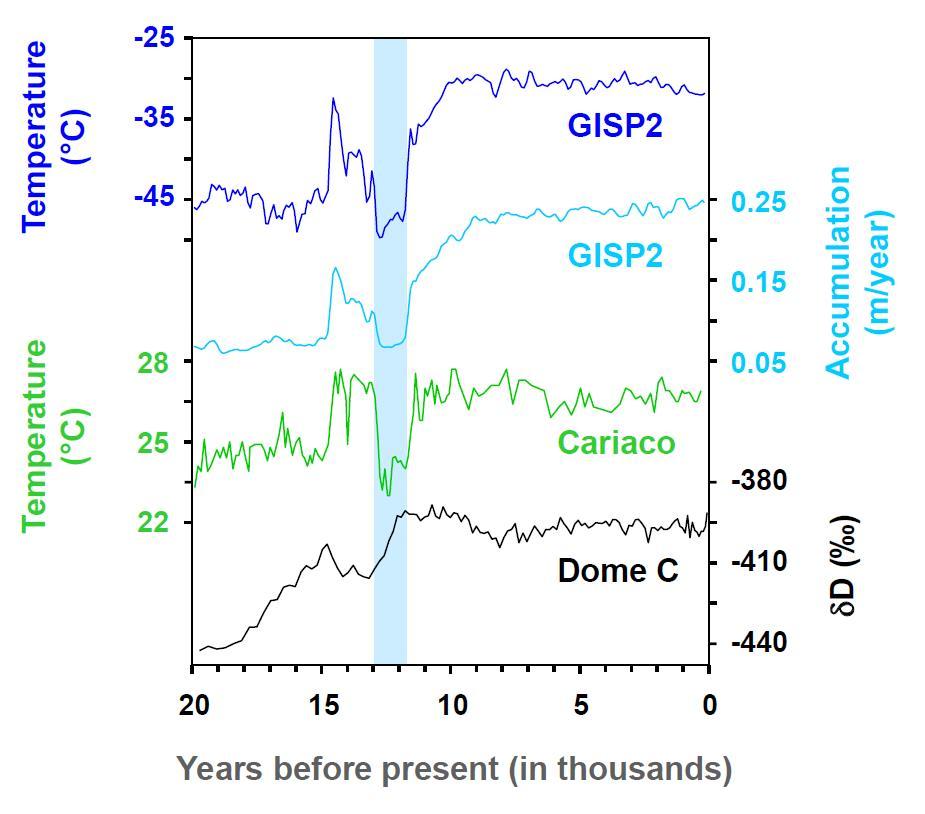
To highlight the potential for major change to the Atlantic meridional overturning circulation (AMOC) I showed this figure showing records spanning the Younger Dryas period from ncdc.noaa.gov/abrupt-climate…. 6/n
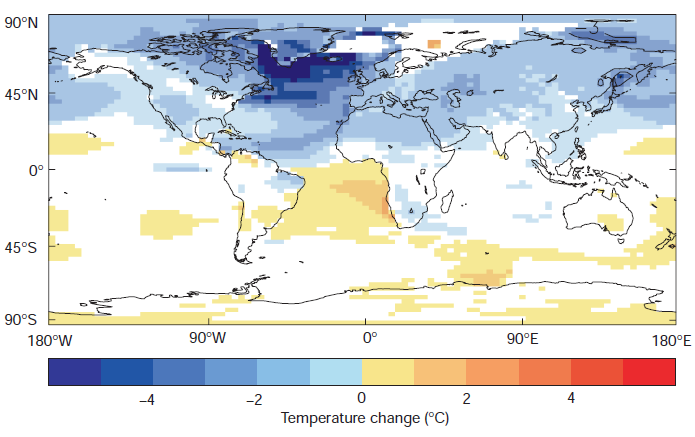
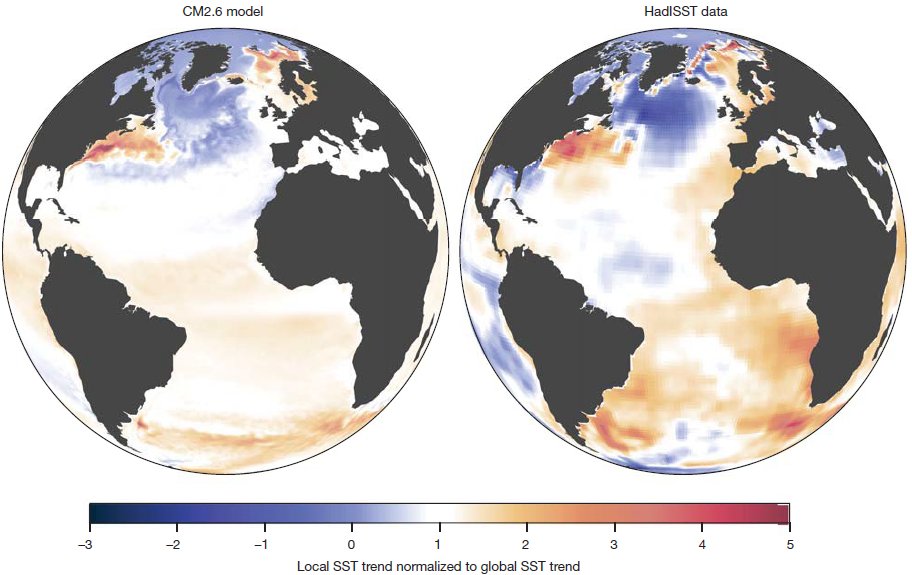
I pointed out that those records are consistent with the surface temperature changes predicted to occur if there is a shutdown of North Atlantic Deepwater formation, based on a modelling study by @rahmstorf - nature.com/articles/natur…. 7/n
To illustrate the complexity of flow in the Antarctic Circumpolar Current, the largest current on Earth, I showed an output from the FESOM model, which was developed by researchers @AWI_Media, and can be found at youtube.com/watch?v=lHPjrq…. 8/n
To illustrate how dense Antarctic Bottom Water cascades off the Weddell and Ross Sea continental shelves and flows northwards at depth beneath the ACC, I showed a model animation produced by @hogg_andy and the @NCInews vizlab, which can be found at youtube.com/watch?v=8VMSF2…. 9/n
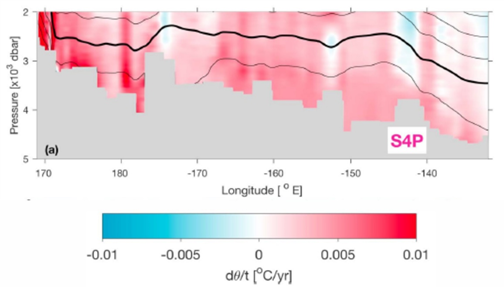
I showed figures that illustrate warming and freshening of Antarctic Bottom Water since the 1980s, including this section along the continental rise off the Ross Sea, from Purkey & Johnson (2013) and Purkey et al. (2019).
journals.ametsoc.org/doi/full/10.11…
agupubs.onlinelibrary.wiley.com/doi/10.1029/20…
10/n
journals.ametsoc.org/doi/full/10.11…
agupubs.onlinelibrary.wiley.com/doi/10.1029/20…
10/n
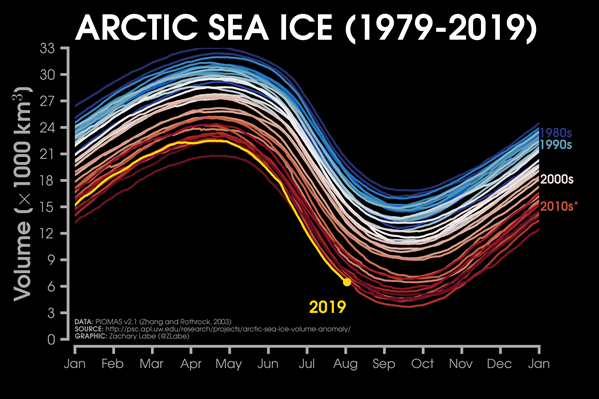
Sea ice is a key component of the polar oceans, in forming dense deep water, as a critical habitat, and because of its albedo effect. I showed this figure from @ZLabe that clearly shows the seasonal variations and overall decline in Arctic sea ice volume since 1979. 11/n
I also showed latest 'sea ice barrels' from @kevpluck, which provide a dynamic view of Arctic, Antarctica and global sea ice areas through the satellite era. They highlight how low both Arctic & Antarctic sea ice areas have been over past few years.
12/n
12/n
Graphs of sea ice area don't convey the dramatic decline of multi-year ice in the Arctic, but this is highlighted in this great animation by Cindy Starr of @NASAViz - svs.gsfc.nasa.gov/4750 (see sea-ice age key in top right). 13/n
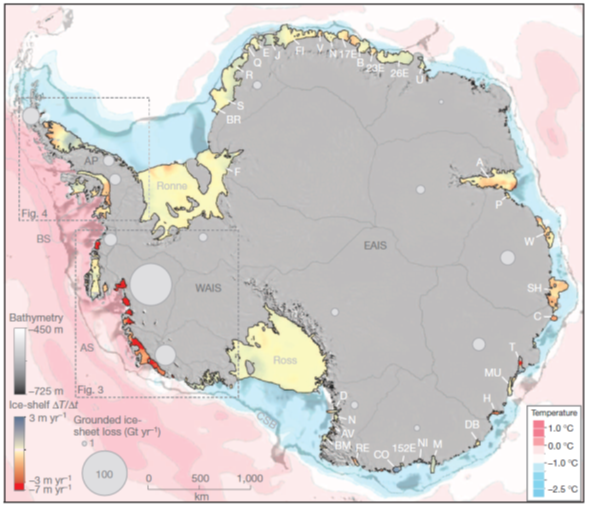
Although large areas of the S. Ocean freeze each winter, there is huge heat energy stored in the water at greater depth. In some sectors warmer water now creeps onto the continental shelf, melting ice shelves, as shown by Pritchard et al. (2012) - nature.com/articles/natur…. 14/n
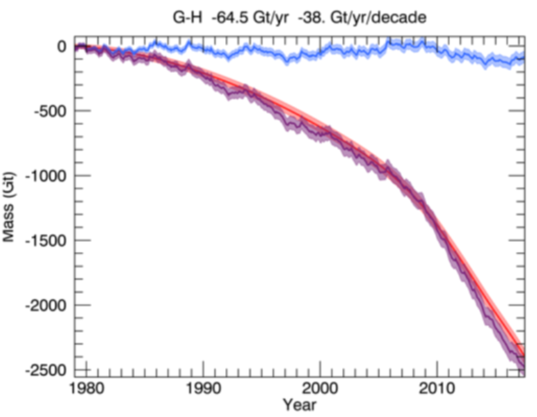
As ice shelves thin they become less effective in holding back glaciers that flow into them, so the glaciers flow faster and discharge more ice to the ocean. This is happening most dramatically in the Amundsen Sea sector of West Antarctica ... 15/n
.. as shown by this graph from the recent assessment by Rignot et al. - pnas.org/cgi/doi/10.107…
The sum of cumulative changes in surface mass balance (blue) and ice discharge (red) in the Amundsen Sea sector since 1980 show accelerating ice loss (purple). 16/n
The sum of cumulative changes in surface mass balance (blue) and ice discharge (red) in the Amundsen Sea sector since 1980 show accelerating ice loss (purple). 16/n
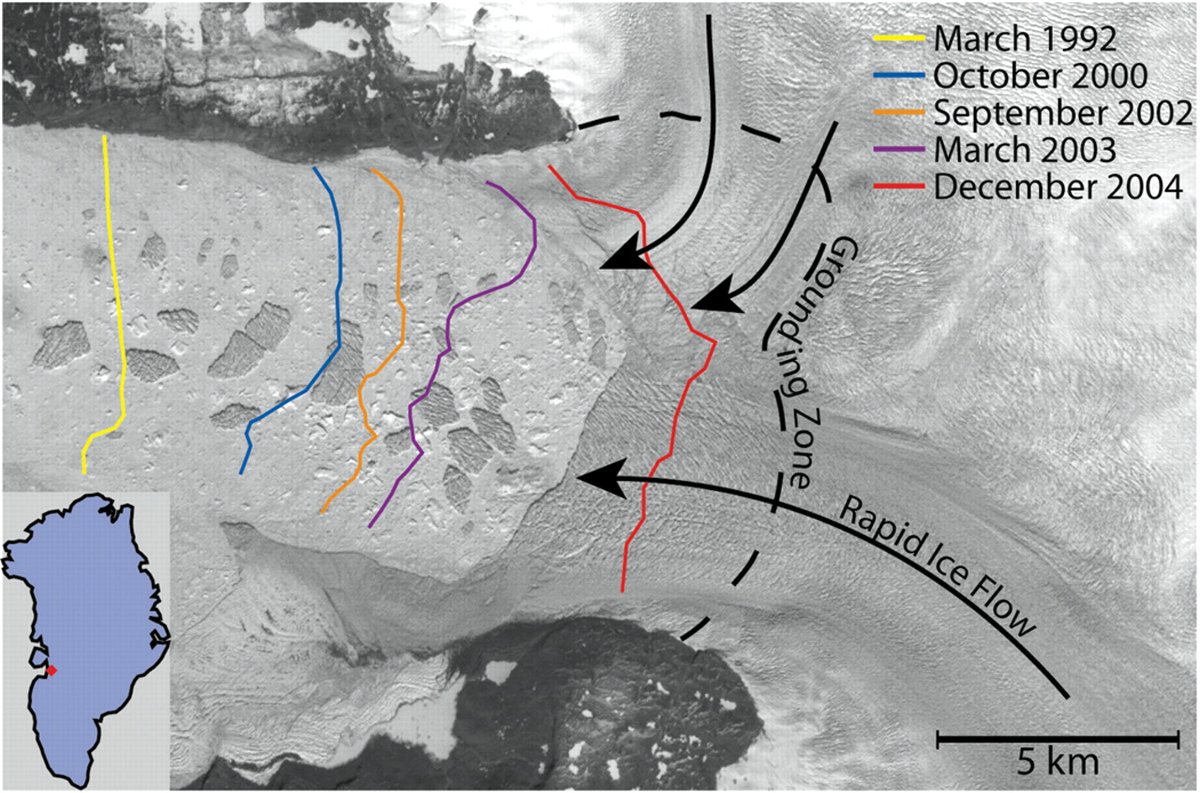
Icebergs are important features and hazards in the polar oceans, but there is a big difference in size between the largest Arctic and Antarctic icebergs. This is because the few Arctic ice shelves are of limited extent, so most Arctic icebergs calve from tidewater glaciers. 17/n
Such icebergs, like the ones seen in this satellite image that calved from the fastest flowing glacier in Greenland, Jakobshavn Isbrae, are rarely more than 2 km across. Image from Alley et al. (2005) - science.sciencemag.org/content/310/57…. 18/n
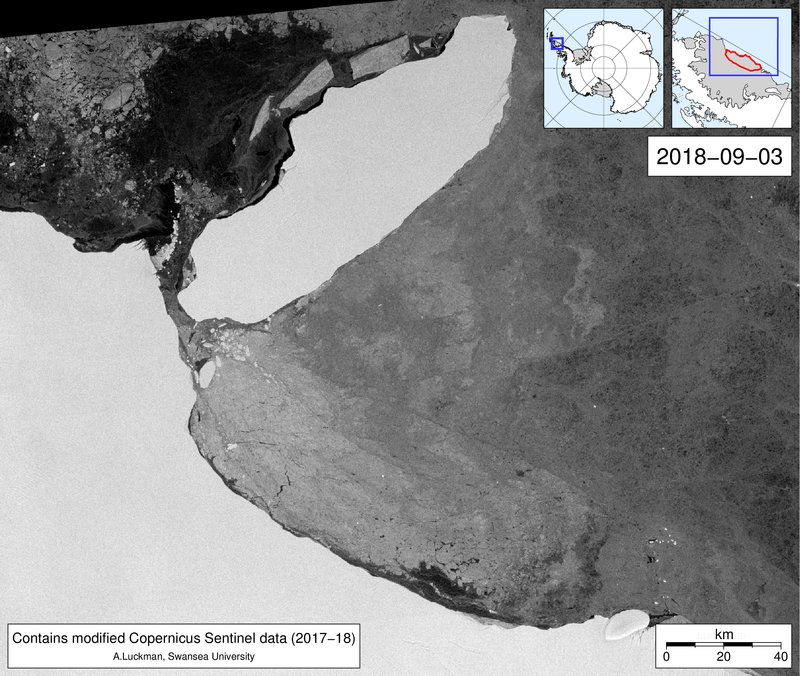
In contrast icebergs with areas of hundreds of km² calve from the large ice shelves around Antarctica on a fairly regular basis. Occasionally giant icebergs with area of thousands of km² are calved, such as A-68. Image by @adrian_luckman using @CopernicusEU Sentinel-1 data. 19/n
A great animation by @kevpluck in collaboration with @MarloWordyBird shows the paths taken by large icebergs as they have drifted away from Antarctica. It shows that most drift westwards in the coastal current until they reach the Weddell Sea. 20/n
Once icebergs reach the Weddell Sea further westwards drift is blocked by the Antarctic Peninsula and they are ejected northwards from the Weddell Gyre through the Scotia Sea. 21/n
Recent scientific drilling in the Scotia Sea on IODP Expedition 382 aimed to recover an integrated record of Antarctic iceberg discharge spanning millions of years from the debris that melted out of them and accumulated in the sediments at the seabed. 22/n publications.iodp.org/preliminary_re…
I should have mentioned earlier that several studies have concluded Atlantic overturning circulation has weakened over recent decades, e.g. Caesar et al. concluded SST anomalies are a 'fingerprint' of 15% weakening since the mid-20th century - doi.org/10.1038/s41586…
23/24
23/24
This was my final summary slide, which I don't think needs any further explanation. 24/24


