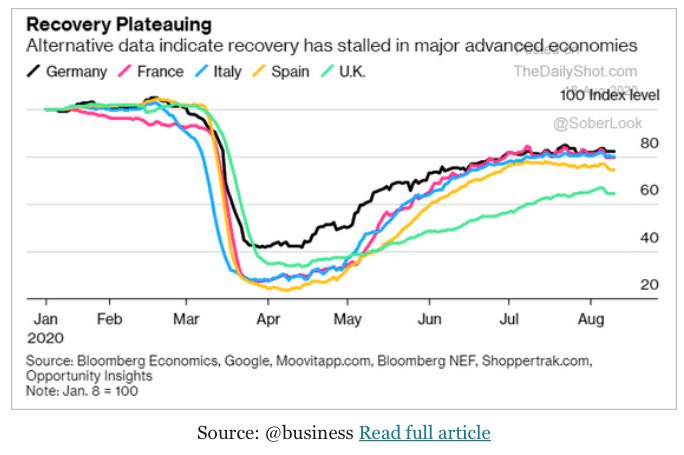
A thread inspired by two charts (h/t @C_Barraud & @economistmeg ) which raise an important question: what will happen to banks if there’s a 2nd wave or 2nd lockdown? 
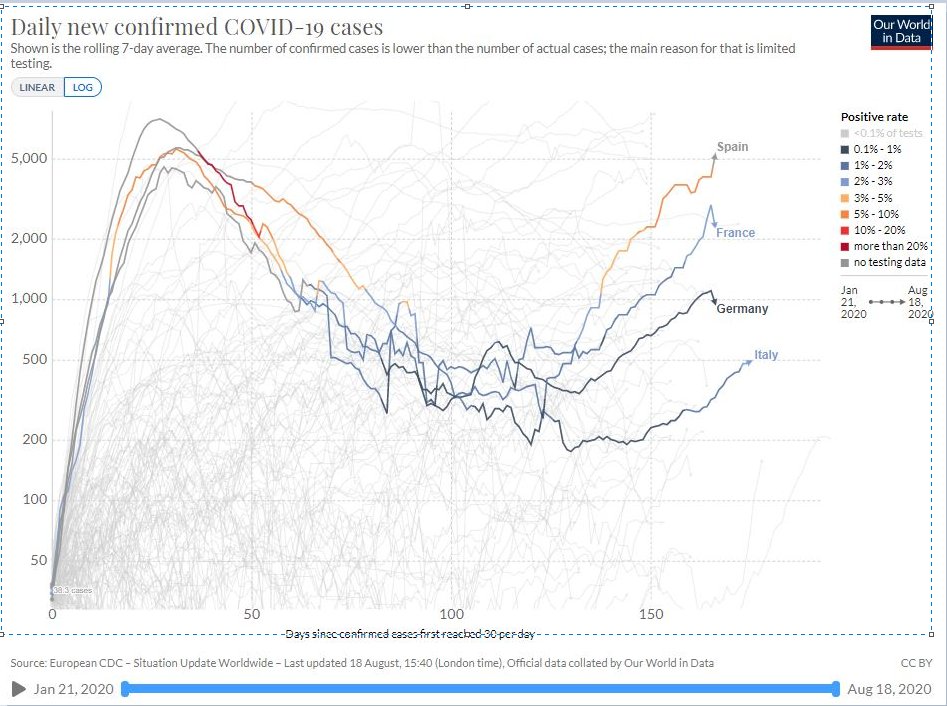
First, an observation: I believe cases will soon get to the all time peaks we saw during lockdowns, but the actual health situation is very different for three reasons: i) we’re better at curing sick people ii) infected people are younger and more importantly...
iii) the real number of cases back in March/April was probably an order of magnitude higher - but we didn’t really do tests so we didn’t know.
So my view is that we won’t get full lockdowns again (as long as ICU are not overwhelmed) but we’ll get tons of micro-decisions that will impact the economy: WFH, transport forbidden, quarantine, school closures, etc. This is what we’re already seeing in high frequency data.
What does it mean for banks, then? Under IFRS9 rules, banks have to prepare for lots of possible macro scenario and calculate loan losses under those scenarios. What they report is a probability-weighted average of those scenarios.
Some banks are kind enough to give excellent disclosures, both on what the scenarios look like and on the amount of credit losses they lead to! This is the best way to know what’s likely to happen if we get to a second wave or a very persistent virus.
One of those banks is AIB and I think it’s a very good case study because i) it’s not the strongest bank in the world, ii) it almost went bust during the 2008+ crisis and iii) it looks like they took a very rigorous approach to provisioning in Q2/H1 (196bps CoR in H1).
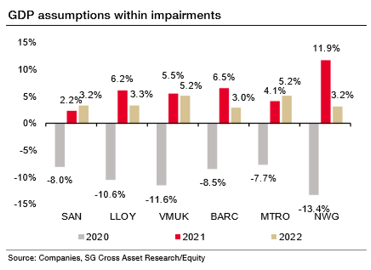
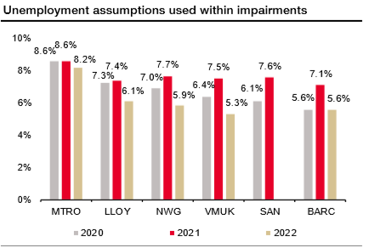
(In the UK, however, they were more on the optimistic side, as the charts below from SG show: their scenario is (2020/2021) GDP: -6.5/+4 Unemployment 7.5%/6%), but it's a small market for them)
Their full range of scenarios include the two that interest me: a persistent virus scenario, which really looks like the one we are currently facing with recovery fizzling out, and the persistent virus + second wave one, which includes a new lockdown in 2021.
The consequences of the two scenarios are charted below in terms of loan losses (as % of RWA). For me, the message is clear: the macro data we’re seeing is broadly consistent with the persistent virus scenario, i.e. a approx. 20% increase in ECL from where we are.
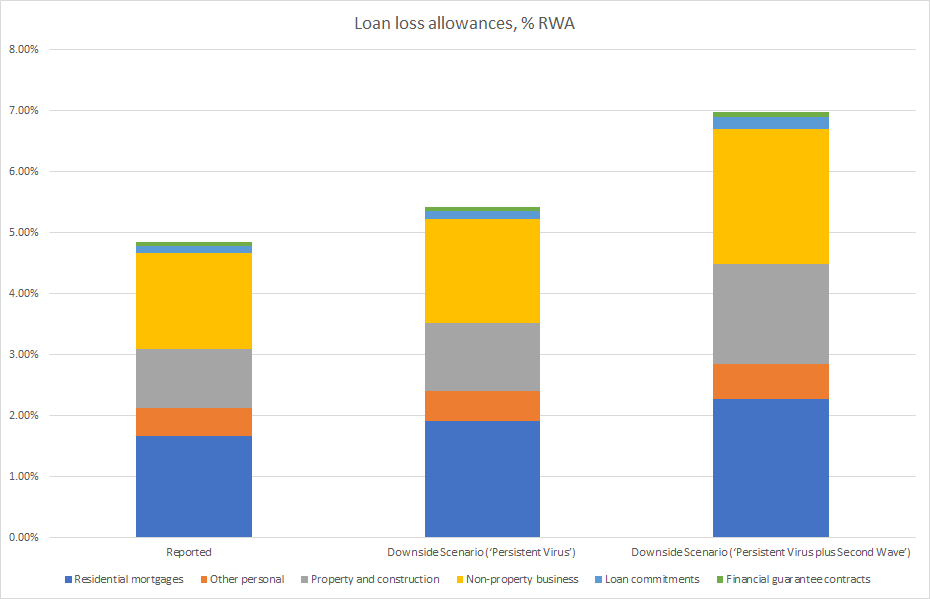
This is mostly an equity topic, not really a credit issue.
The genuine systemic risk we are facing today is 2nd wave scenario, consistent with a 40%-50% increase in ECL. For AIB which is over-capitalized, it's not a big credit issue, but if you’re looking at weaker lenders and want to be careful, that’s what you need to watch.
And also the share of moratorium loans that went into Stage 2, because not everyone is telling you the truth !
But that’s another story for another day. Stay safe !
But that’s another story for another day. Stay safe !