
If you are using matplotlib in your day to day coding activity and didn't no the crux of it, I want to you take a look at this below thread. I'm sure you will learn and apply it.
So, here is what all we need to know about matplotlib, an excellent visualization library in python
So, here is what all we need to know about matplotlib, an excellent visualization library in python
1. In this thread we will go through some basic patterns and practises to help you get started with the library
It will basically help us plot the data into the figures and can contain axes, i.e. an area where points can be specified in x/y/z co-ordinates
First let's import it
It will basically help us plot the data into the figures and can contain axes, i.e. an area where points can be specified in x/y/z co-ordinates
First let's import it

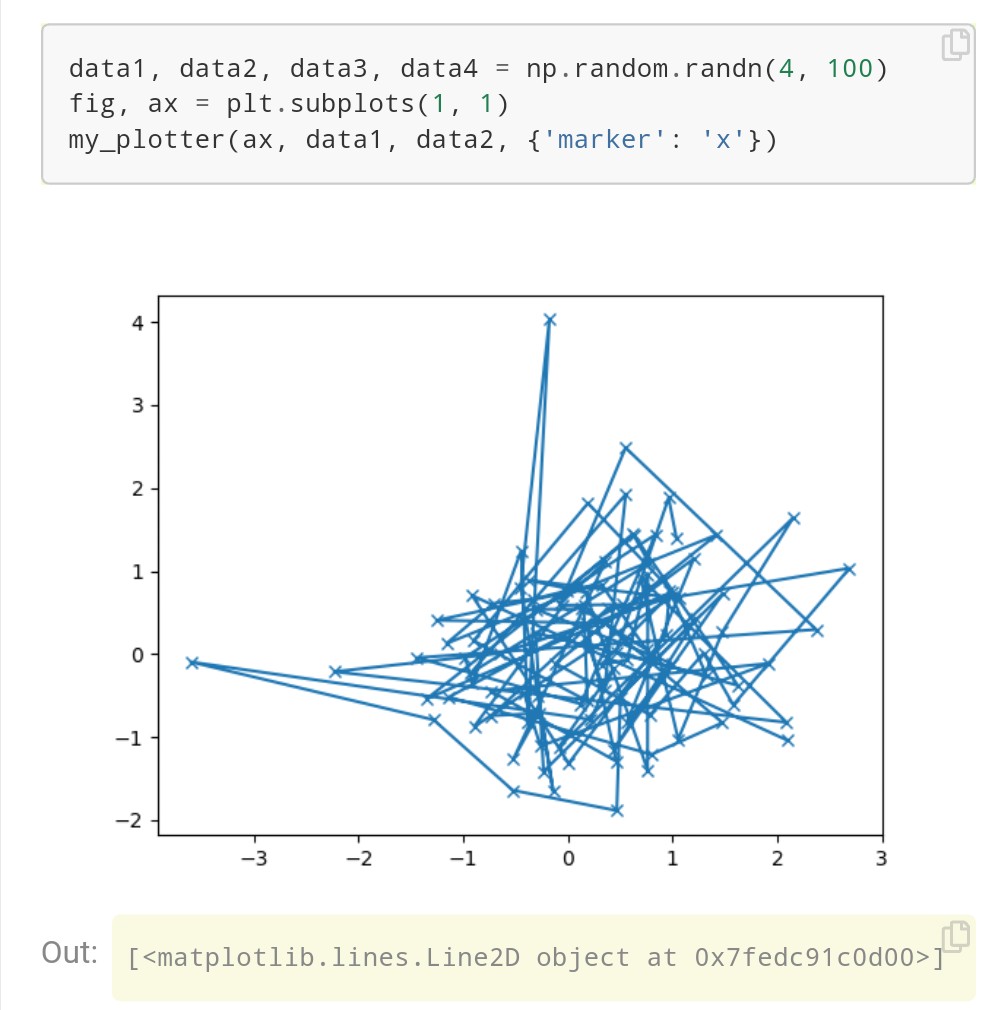
2. The simple way of creating axes is using pyplot.subplots and we can Axes.plot to draw some data on the axes.
Below is how we can do it.
Below is how we can do it.


3. In matplotlib, for each axes graphing method, there is corresponding function in matplotlib.pyplot module which performs the plots on current axes, which also creates axis if they don't exist.
Like below:
Like below:

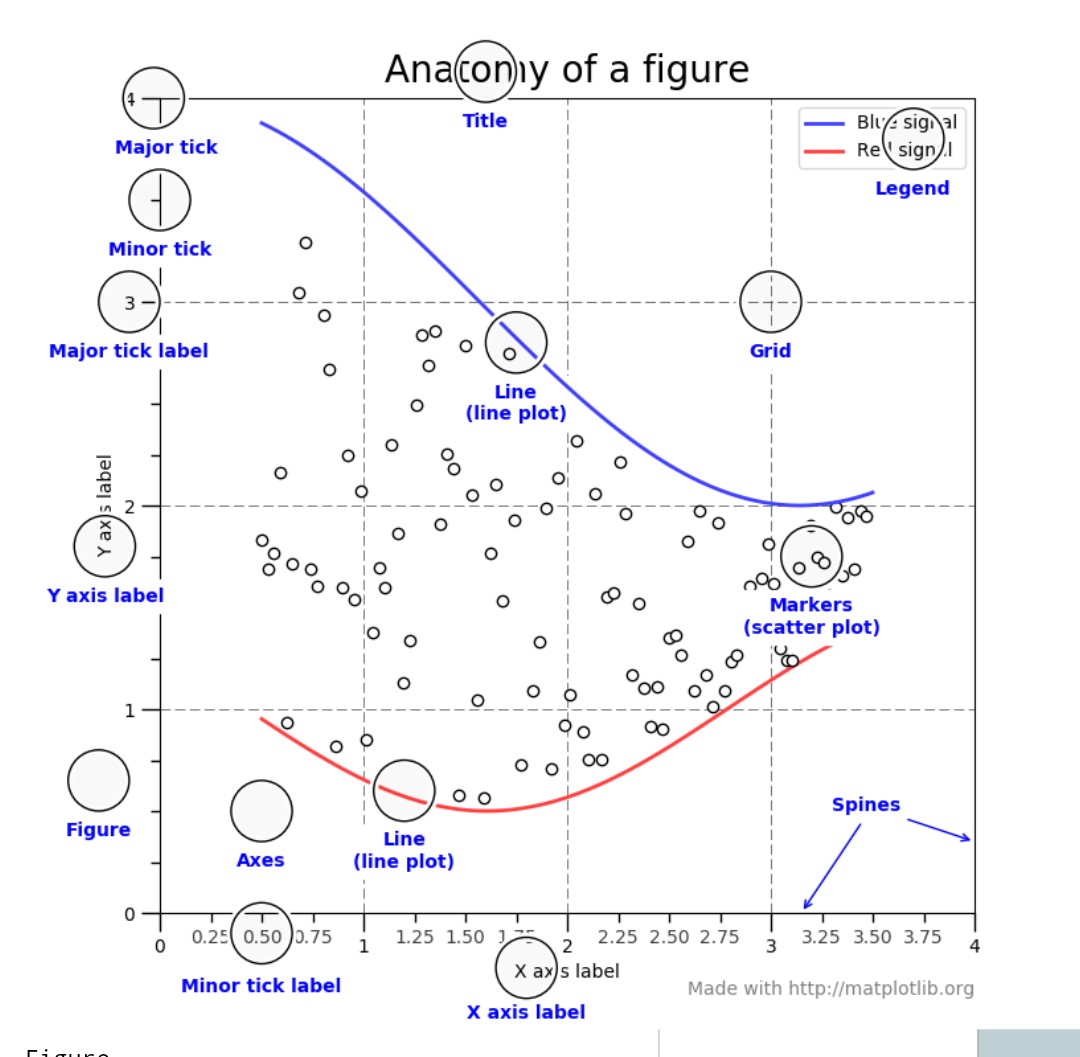
4. Let's understand the graph structure and its various other components from this excellent below image from matplotlib community.
Source: matplotlib.org
Source: matplotlib.org
5. FIGURE.
The whole figure keeps track of all the child Axes, titles, and it's canvas. It is the main object which gets out data plotted into graphs, it can contain n number of Axes, typically having atleast one.
A simple way of creating figure is shown below:
The whole figure keeps track of all the child Axes, titles, and it's canvas. It is the main object which gets out data plotted into graphs, it can contain n number of Axes, typically having atleast one.
A simple way of creating figure is shown below:

6. AXES
This is the region of image with the data space, as I mentioned before a given figure can contain any number of Axes, but an Axes can contain only one figure. The Axes contains 2 Axis objects in case of 2D Data (There is difference between Axes and Axis).
This is the region of image with the data space, as I mentioned before a given figure can contain any number of Axes, but an Axes can contain only one figure. The Axes contains 2 Axis objects in case of 2D Data (There is difference between Axes and Axis).
7. AXES (Cont...)
This also take care of data limits in the graph like below.
axes.Axes.set_xlim() and axes.Axes.set_ylim(), each Axes has a title like set_title(), and x label set_xlabel(), and y label can be set _ylabel().
This also take care of data limits in the graph like below.
axes.Axes.set_xlim() and axes.Axes.set_ylim(), each Axes has a title like set_title(), and x label set_xlabel(), and y label can be set _ylabel().
8. AXIS
This are line objects which take care setting the graph limits and generating the marks on axis and string labels on the this marks, the location of this marks can be determined by Locator object and string labels via Formatter Object.
This are line objects which take care setting the graph limits and generating the marks on axis and string labels on the this marks, the location of this marks can be determined by Locator object and string labels via Formatter Object.
9. ARTIST
Basically, whatever we see on figure is an artist itself, (Figure, Axes, Axis Objects). This also includes Text, Line2D, Collection and Path objects when figure is rendered all this artists are drawn on canvas.
Basically, whatever we see on figure is an artist itself, (Figure, Axes, Axis Objects). This also includes Text, Line2D, Collection and Path objects when figure is rendered all this artists are drawn on canvas.
10. Types for plotting
Always expected behaviour is to convert any object to numpy.array before plotting it using matplotlib.
Like below example of pandas.
Always expected behaviour is to convert any object to numpy.array before plotting it using matplotlib.
Like below example of pandas.

11. Object orientation and Pyplot.
Fundamentally there are two ways to use the matplotlib,
a. Expliticly create figures, axes and call methods on top of it.(OOP style)
b. Rely on Pyplot to automatically create and manage figures and axes.
Below are examples for both:
Fundamentally there are two ways to use the matplotlib,
a. Expliticly create figures, axes and call methods on top of it.(OOP style)
b. Rely on Pyplot to automatically create and manage figures and axes.
Below are examples for both:


12. The general tendency of usage from above two methods is, we normally use Pyplot approach for interactive plotting like for example on jupyter notebook, and prefer OOP style on non interactive plotting, which is on normal functions ans scripts.
13. Typically what we do when coding and visualising the data using matplotlib we tend to making same plots over and over again, but probably with different data sets and ranges which leads to creating specialized function to do the plotting
The recommended function is as below
The recommended function is as below


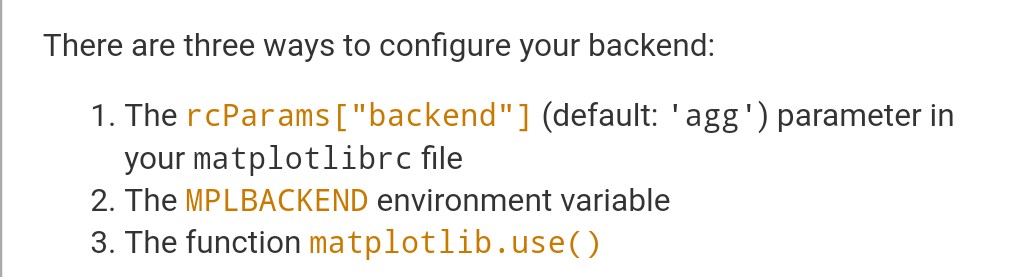
14. BACKEND
We see lot of documentation and websites mentioning lot about the backends, the reason is matplotlib supports various targets like for example on jupyter notebook, inline functions, wxpython, pygtk and so on
To support all this use cases, matplotlib targets backend
We see lot of documentation and websites mentioning lot about the backends, the reason is matplotlib supports various targets like for example on jupyter notebook, inline functions, wxpython, pygtk and so on
To support all this use cases, matplotlib targets backend
15. There are different ways to select the backend for matplotlib.
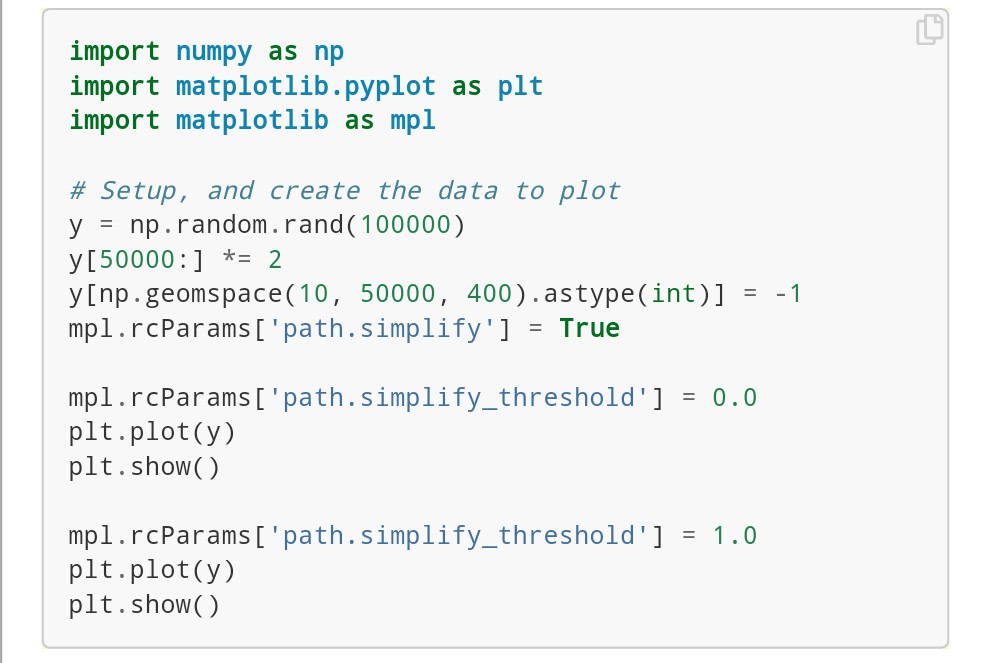
16. PERFORMANCE.
Whether using interactive mode or programmatically plotting the graphs, rendering can be very painful sometimes for matplotlib, so the library provides some ways to reduce the rendering time for the graphs.
Whether using interactive mode or programmatically plotting the graphs, rendering can be very painful sometimes for matplotlib, so the library provides some ways to reduce the rendering time for the graphs.
17. Contd...
a. Line Segment Simplication.
For plots having line segments for example, typical line plots, outlines of polygon and so on. The time to render can be reduced as shown in below script.
a. Line Segment Simplication.
For plots having line segments for example, typical line plots, outlines of polygon and so on. The time to render can be reduced as shown in below script.
18.
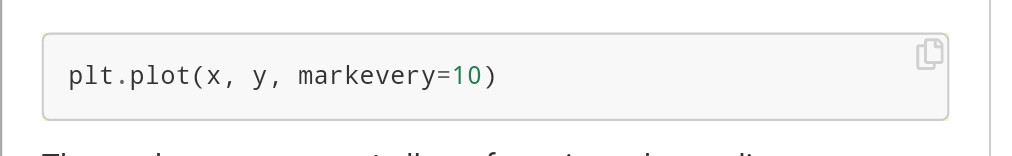
b. Marker Simplication
Marker Simplication are only available for Line2D objects, like shown below:
b. Marker Simplication
Marker Simplication are only available for Line2D objects, like shown below:
19.
c. Splitting lines into multiple smaller chunks.
Script as below:
c. Splitting lines into multiple smaller chunks.
Script as below:

Thats it for his thread.
I'm sure you have gained some knowledge from this thread and whenever you go on using matplotlib next time, you will have the all new different experience.
This is under #BridgetTeachings.
#matplotlib
#numpy
#MachineLearning
#visualization
#NN
I'm sure you have gained some knowledge from this thread and whenever you go on using matplotlib next time, you will have the all new different experience.
This is under #BridgetTeachings.
#matplotlib
#numpy
#MachineLearning
#visualization
#NN

