This is a paper about mapping volcanic ash clouds. Mapping volcanic ash clouds is hard. See the end of this blog post for details: all-geo.org/volcan01010/20… TL;DR you can use satellites or computer simulations but both have limitations. Simulations depend on good input data. 1/
The most important input for a simulation of volcanic ash dispersion is plume height. Particles released from higher travel further and in different directions to those below. But there is a more important reason... 2/
The plume height is used to estimate how much ash is being released - the Mass Eruption Rate (MER). MER is proportional to plume height to the power of 4, so a small change in height goes a long way. A 6 km high plume has an MER of 2x a 5 km high plume. 3/
If you double the MER, you double the ash concentration in the modelled output everywhere where ash is simulated to be. This should have big implications for the area where aeroplanes could be prevented from flying. This is where Fabio's work comes into it. 4/
< now Twitter won't let me save the thread as a draft, so you'll have to wait until I get a chance to finish it to learn what we found >
Tobias and Fabio created a tool called REFIR to calculate Mass Eruption Rates. It uses plume height observations (e.g. from radar) and weather data. Wind matters because it takes a more powerful eruption to reach a certain height when the wind is strong. 5/
Fabio calculated possible MERs for the Eyjafjallajokull 2010 eruption. Radar-based plume-heights had uncertainty of +/- 1km; he ran min, max, avg. He also made estimates with and without factoring in the wind. Frances Beckett at @MetOffice_Sci then simulated the ash clouds. 6/
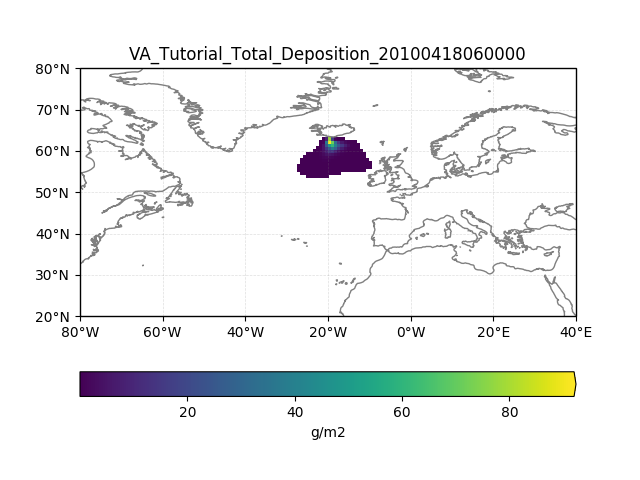
These resulting maps are cropped from Fig 6a and show the following scenarios:
Max height, with wind | Min height, with wind
-------------------------------------------------------
Max height, no wind | Min height, no wind
7/
Max height, with wind | Min height, with wind
-------------------------------------------------------
Max height, no wind | Min height, no wind
7/

I crunched the outputs and found that the red + grey ash-advisory area (with concentration greater than 2 mg m-3, where aircraft require special permission to fly) was up to 5 times higher when the wind is factored into MER calculations, compared to when it isn't. 8/
Our paper helps understand uncertainty in ash cloud model results and highlights the importance of good input parameters to simulations. The @EUROVOLC project is researching "near real-time detection of critical eruption source parameters". eurovolc.eu/?page_id=1173
REFIR is written in Python and is now available under the #opensource GPLv3 licence from the @BritGeoSurvey GitHub pages: github.com/BritishGeologi… 6/
.@decvalts and I turned the Python processing scripts into a more general tool for ash model plotting. It is called ash-model-plotting. It works with Name, HYSPLIT and FALL3D models.
It's also #opensource and available on @BritGeoSurvey GitHub. github.com/BritishGeologi…
It's also #opensource and available on @BritGeoSurvey GitHub. github.com/BritishGeologi…