I track universe of these ~900 companies (by market cap). Below are some charts to give a sense of how things of moved in last few year and last few weeks. Data is from 1st Jan 2018 to 31st Aug 2020
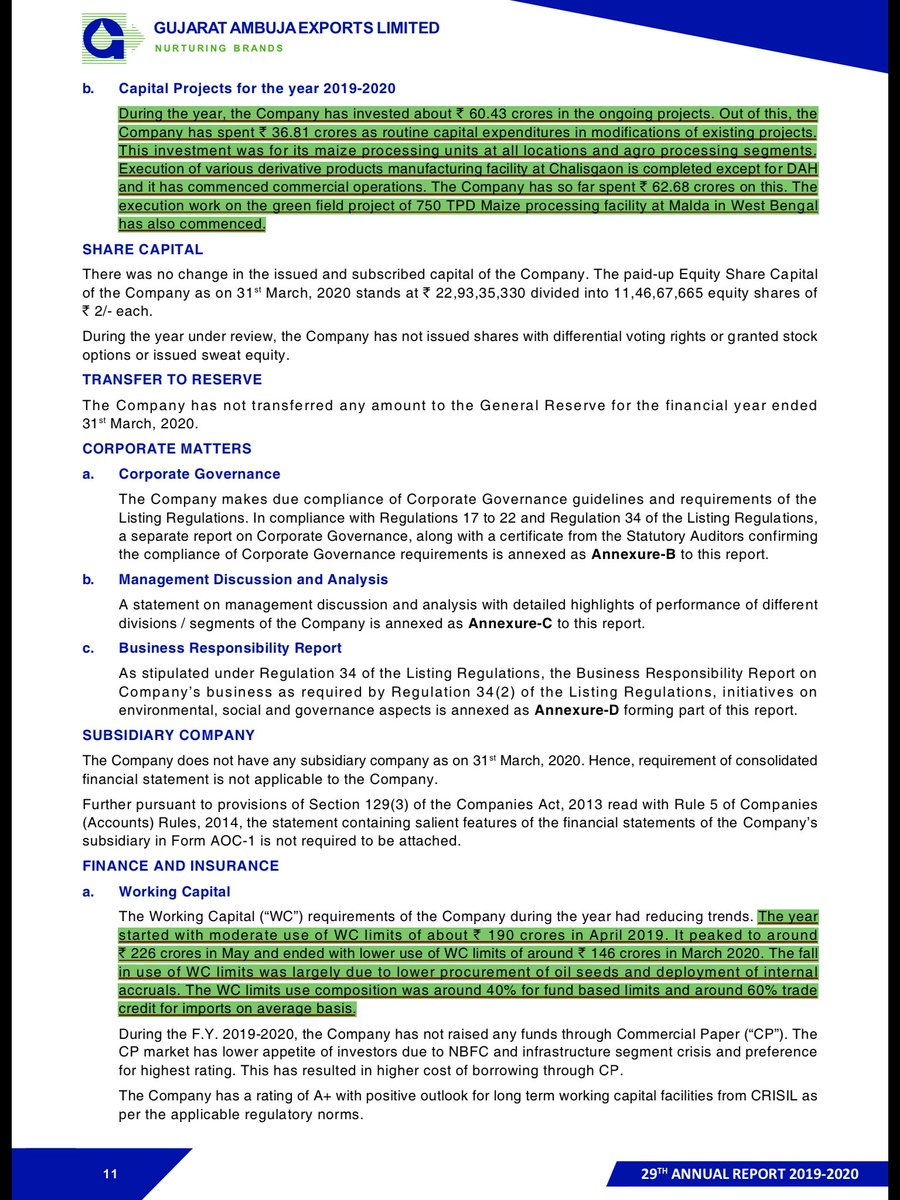
#chart1 : % of stocks closed above 50 DEMA n 200 DEMA. Insight: After Jan 1, 2018, last week was 2nd occasion when >70% of stocks have hit closing price > 200 DEMA
Blue bar: Close>50 DEMA, Red: Close>200 DEMA (DEMA: Day Exponential Moving Average)
Blue bar: Close>50 DEMA, Red: Close>200 DEMA (DEMA: Day Exponential Moving Average)
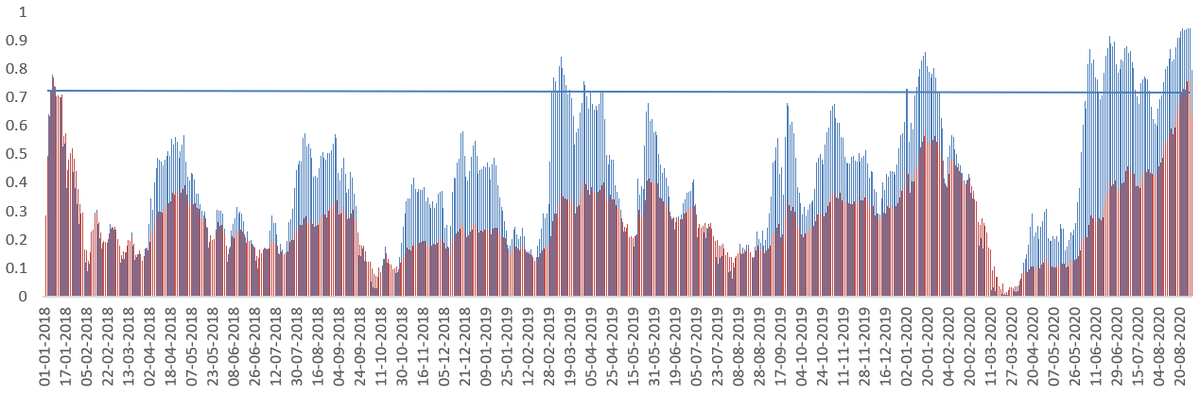
#Chart2: Close > 20 DEMA. Extreme behavior <10% and >90% are rare. In last 2.8 year, <10% has happened across only 2 months (ILFS Crisis and Corona Crisis). However, in last 3 years, this is longest continuous occasion of 2-3 months when close price > 20 DEMA for >90% of stocks
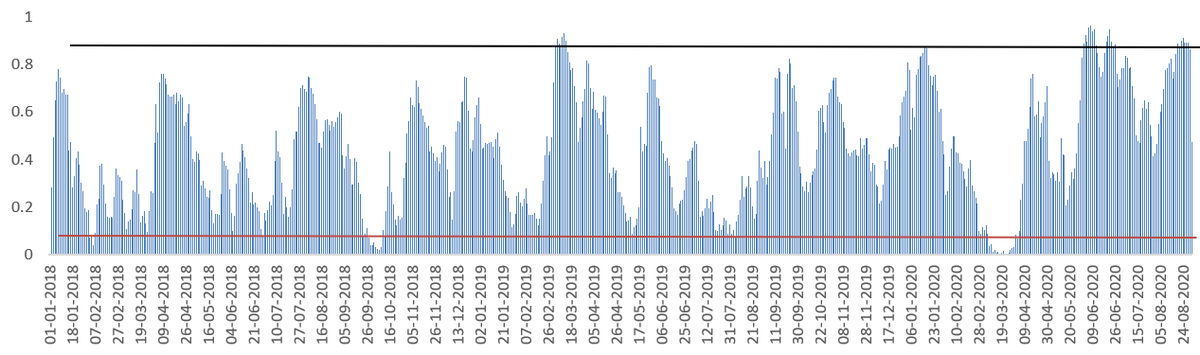
#chart3: Blue bar: % of companies with 20 DEMA>50 DEMA, Red bar: % of companies with 50 DEMA>200 DEMA, For the 1st time in 2.8 years, we had >90% companies with 20 DEMA>50 DEMA. On 1st Jan 2018, we had >70% companies with 50 DEMA>200 DEMA, we have not seen that yet since then
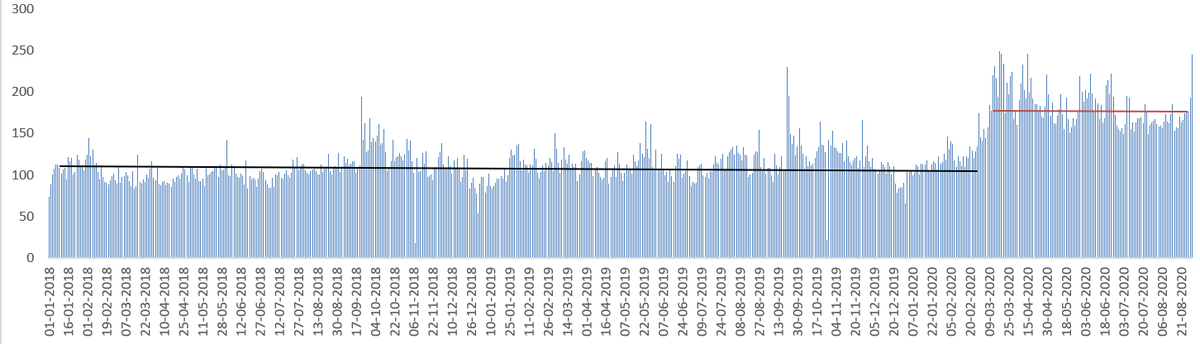
#chart4: Trend of total count of trades (blue bar)
There has been clearly visible shift in count of trades since 12th March 2020. Prior to that , average count of daily trades were ~105 Lakh, this has gone up to ~185 Lakh which is a whooping 80% jump with ~same no. of companies
There has been clearly visible shift in count of trades since 12th March 2020. Prior to that , average count of daily trades were ~105 Lakh, this has gone up to ~185 Lakh which is a whooping 80% jump with ~same no. of companies
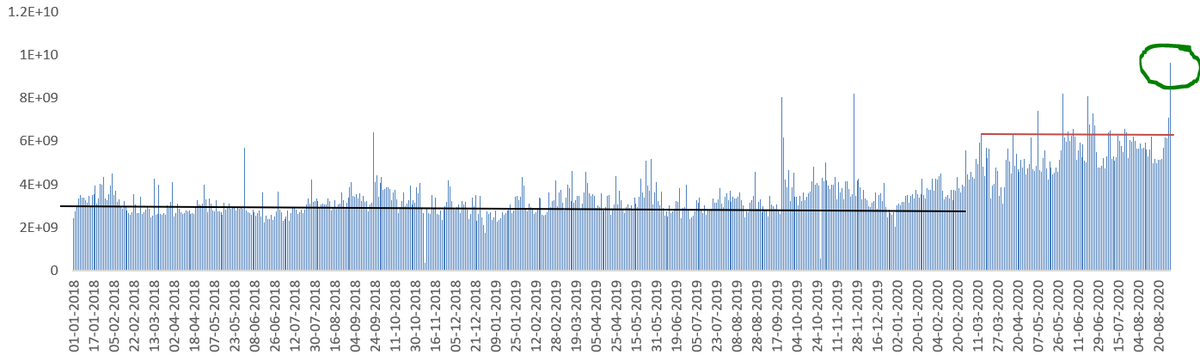
#chart5: Trend of daily total turnover (blue bar)
Likewise there has been clearly visible shift in daily turnover. Also, turnover on 31st Aug was highest of 2.8 years with huge spike
Likewise there has been clearly visible shift in daily turnover. Also, turnover on 31st Aug was highest of 2.8 years with huge spike
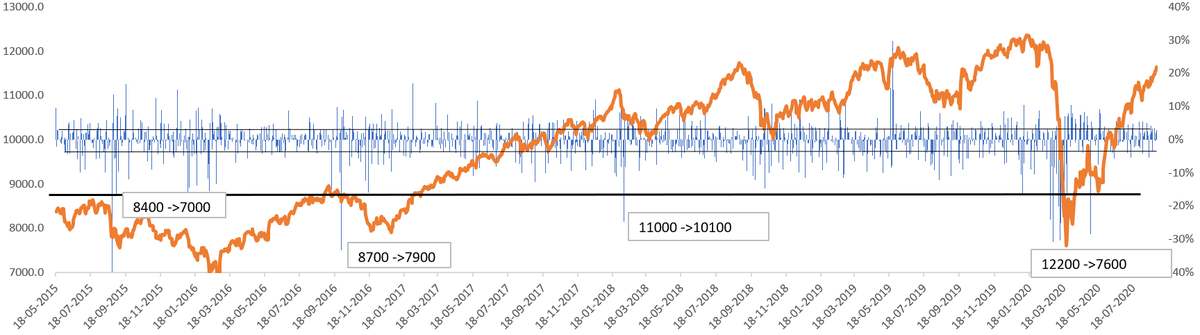
Signing off with last chart, #chart 6: NIFTY(orange) vs % of change in daily VIX(blue bar). Kindly note whenever VIX spiked beyond 20% on -ve side, fall has been significant (dark black horizontal line threshold, single or repetitive). For 31st Aug 2020, this was -24%.