1. Do Integrated Assessment Models (IAMs) show similar pathways to below 1.5°C?
Robust: All have less fossils, more non-fossils.
Details (a thread): The range of primary energy in 2100 is from 300EJ to 1200EJ (300-700 in 2050). Different IAMs (colours) show different outcomes.
Robust: All have less fossils, more non-fossils.
Details (a thread): The range of primary energy in 2100 is from 300EJ to 1200EJ (300-700 in 2050). Different IAMs (colours) show different outcomes.
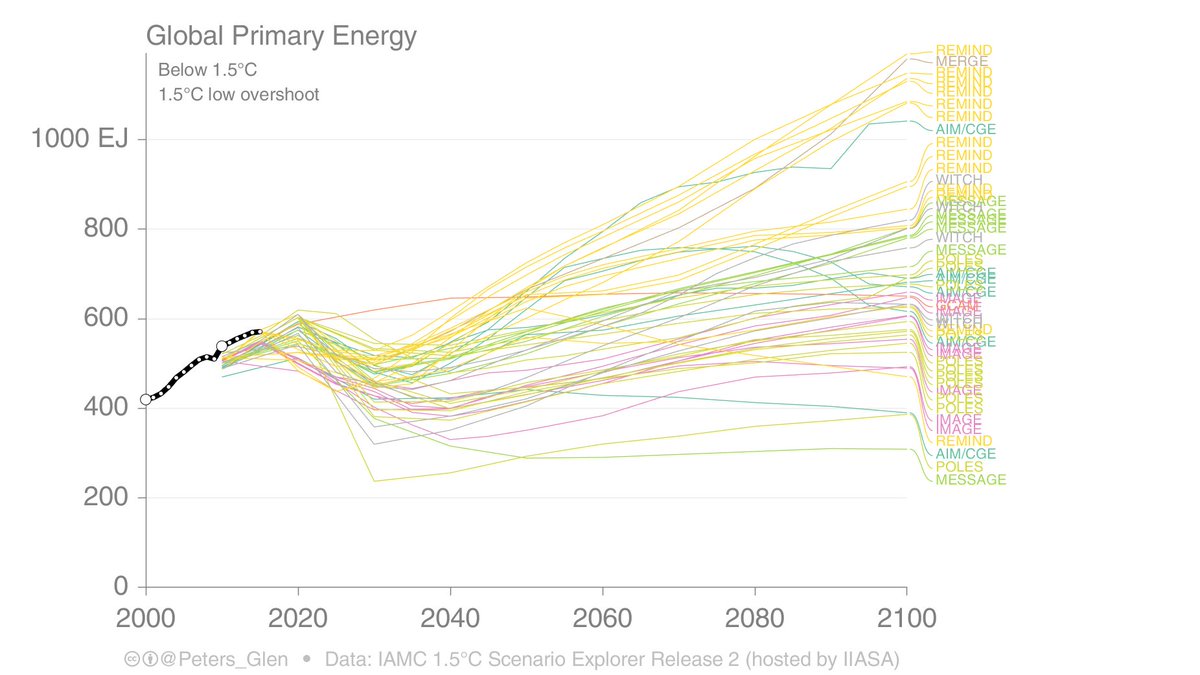
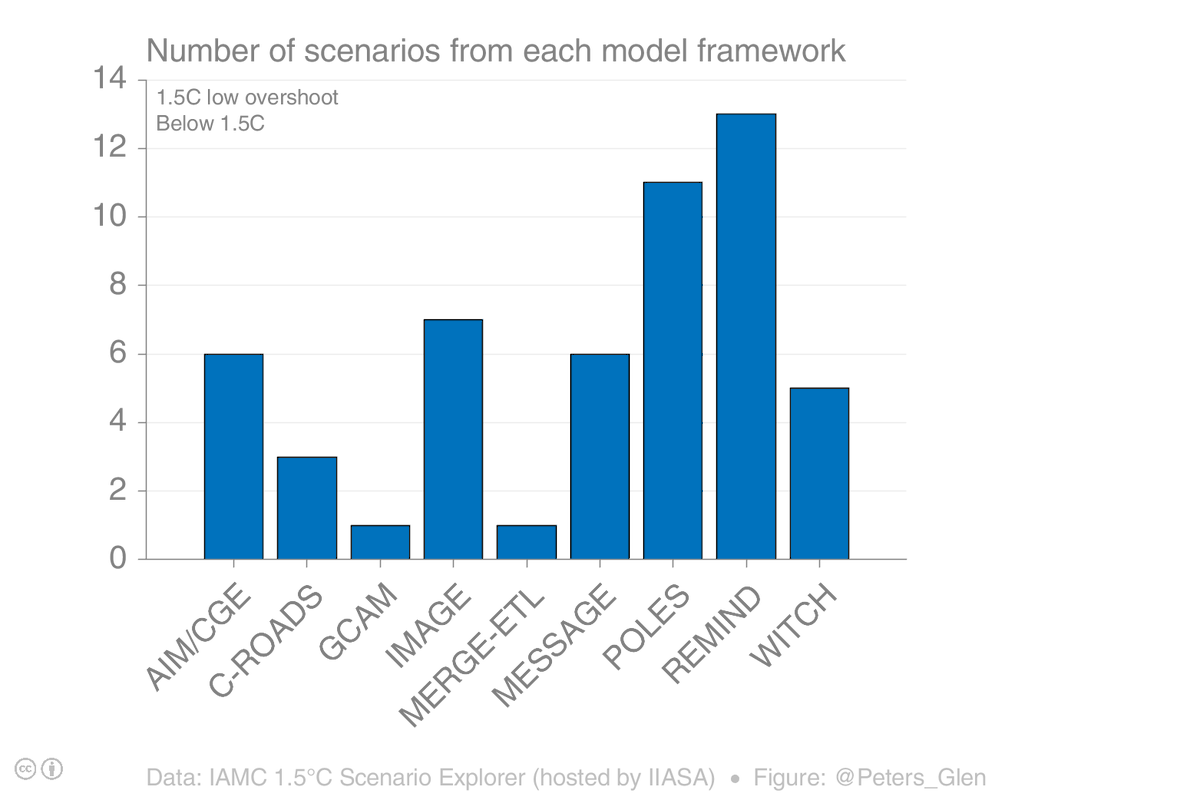
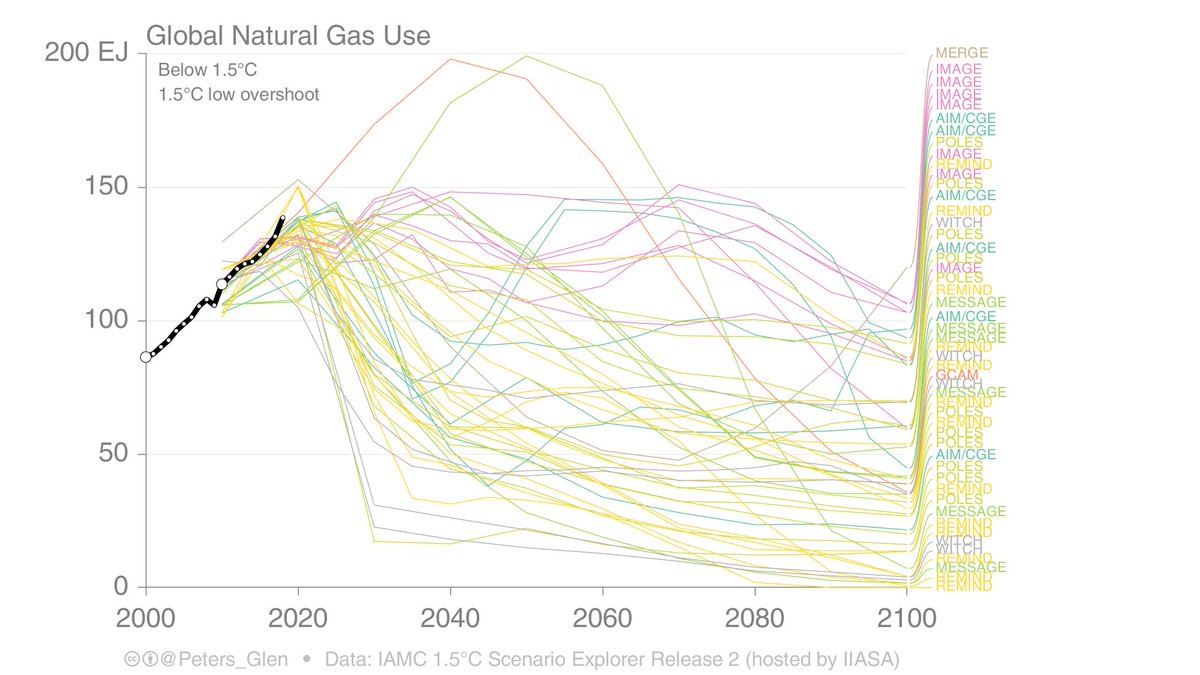
2. I am going to show different scenarios from the IPCC 1.5°C Scenario Database (#SR15). There are 53 scenarios with no or low overshoot of 1.5°C, but only 9 model "families" (grouping versions of the same model).
Important: the distribution of models in SR15 is not uniform.
Important: the distribution of models in SR15 is not uniform.
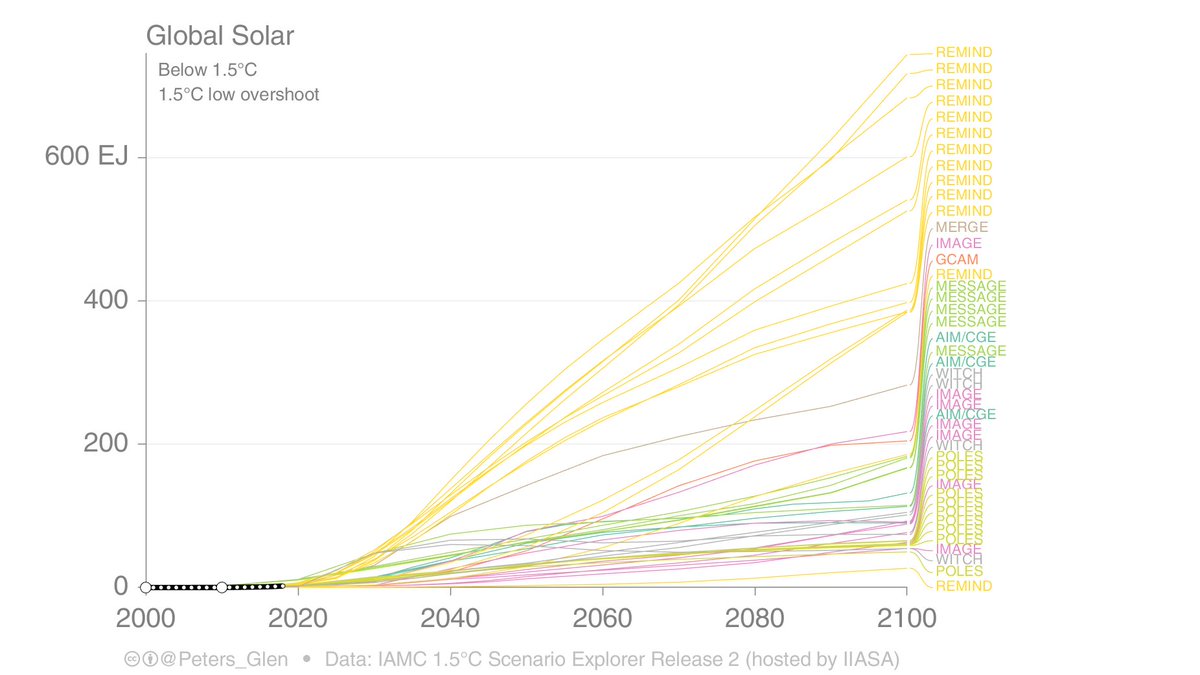
3. Some IAMs prefer certain technologies over others (in the respective IAM frameworks & assumptions). REMIND has consistently has more solar than other IAMs, POLES is at the other end of the scale.
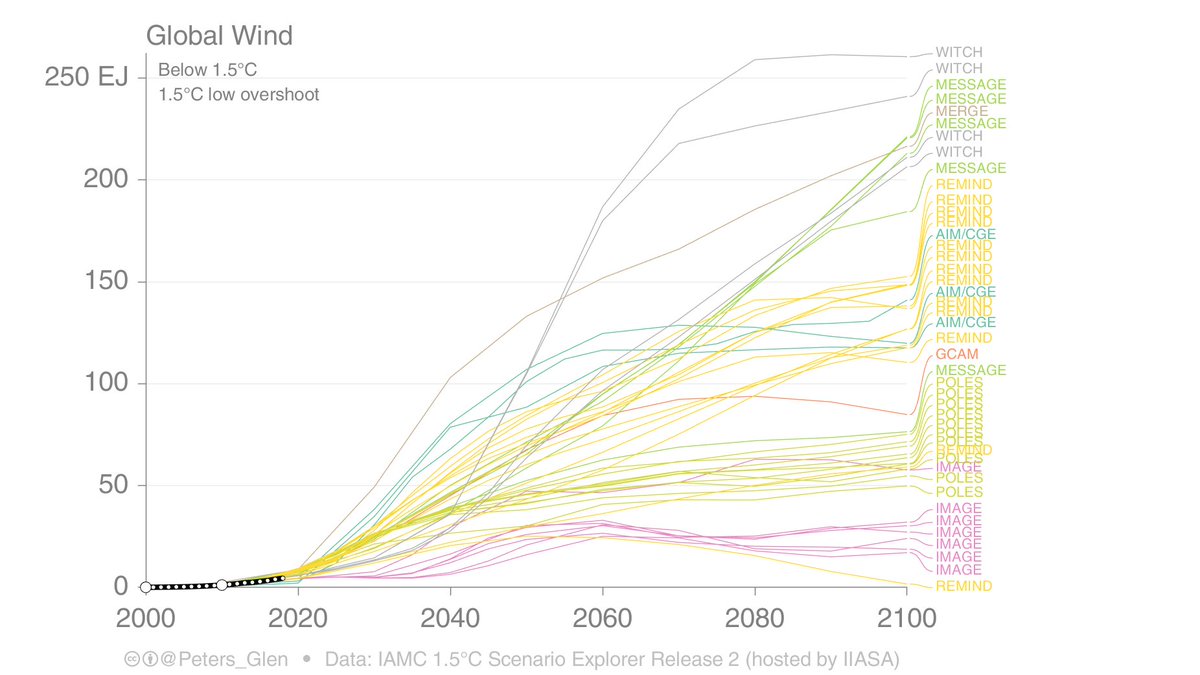
4. WITCH & MESSAGE find higher shares wind, IMAGE low. REMIND & POLES are in the middle.
[Note many scenarios are sensitivity studies, egs, run with constraints on particular technologies]
[Note many scenarios are sensitivity studies, egs, run with constraints on particular technologies]
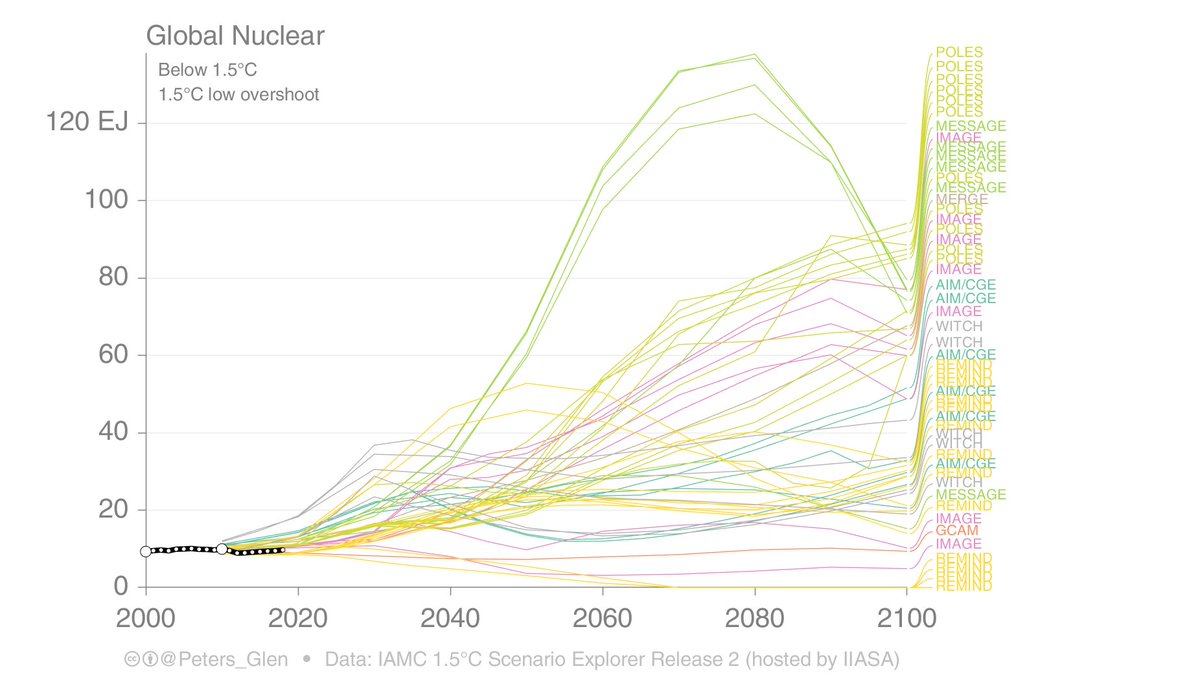
5. POLES and MESSAGE are much higher on nuclear (& GCAM if available), while REMIND is quite low.
You may see a pattern now. REMIND, for example, can be low on nuclear as it is high on wind & solar. If an IAM is low on something, it usually means it is high on something else.
You may see a pattern now. REMIND, for example, can be low on nuclear as it is high on wind & solar. If an IAM is low on something, it usually means it is high on something else.
6. Many IAMs use high levels of bioenergy, and many studies apply a constraint of 300EJ/yr. REMIND, for example, is limited by that constraint. REMIND ran a variety of sensitivity studies on bioenergy, which explains is wide variation. No constraints, higher bioenergy.
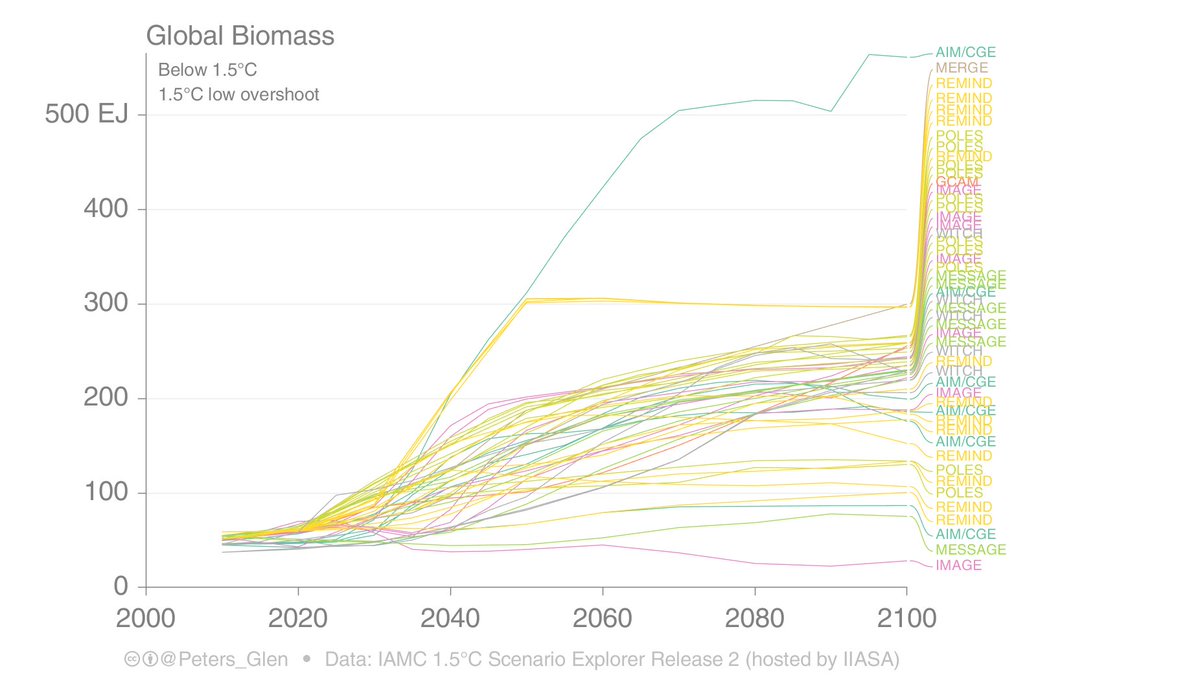
7. As people have heard endless now, IAMs seem to like BECCS! Some models/scenarios don't use BECCS. C-ROAD has no BECCS (not shown), others ran sensitivity studies that effectively limited BECCS (eg, lower bioenergy).
Either way, there is a lot of BECCS in these scenarios...
Either way, there is a lot of BECCS in these scenarios...
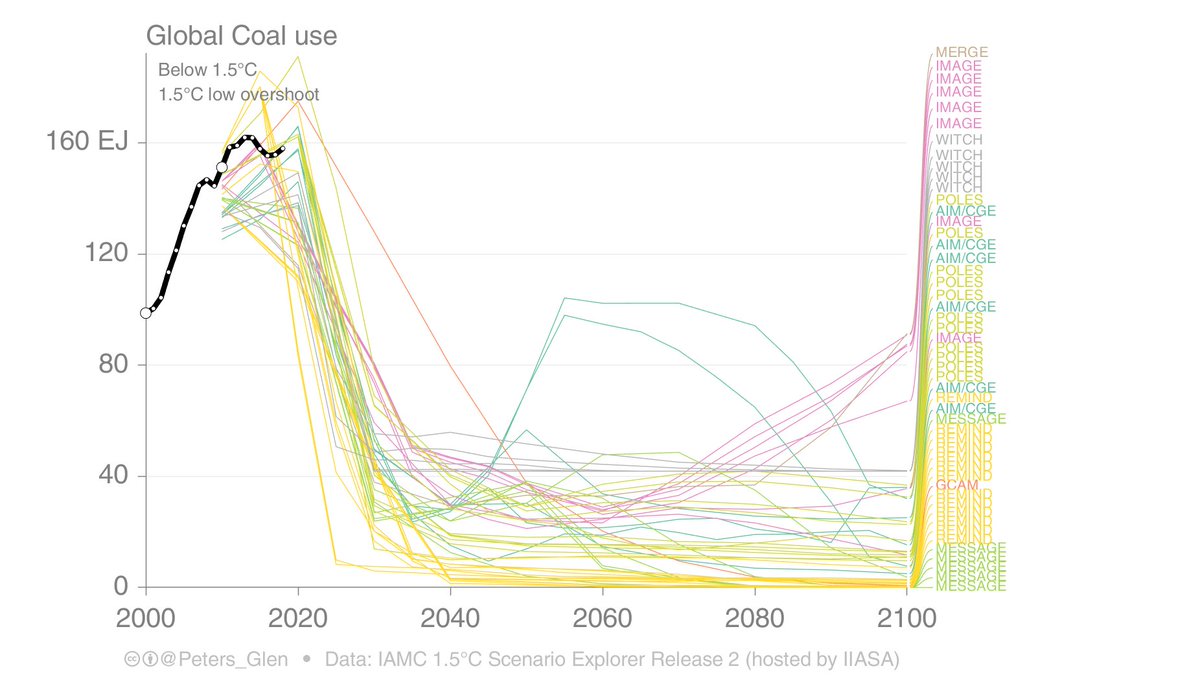
8. All IAMs have big drops in coal, but some have a coal resurgence post-2050. Some IAMs go to zero coal, som maintain levels at about 25% of today's level.
Coal is out, but not necessarily completely (eg, with CCS).
Coal is out, but not necessarily completely (eg, with CCS).
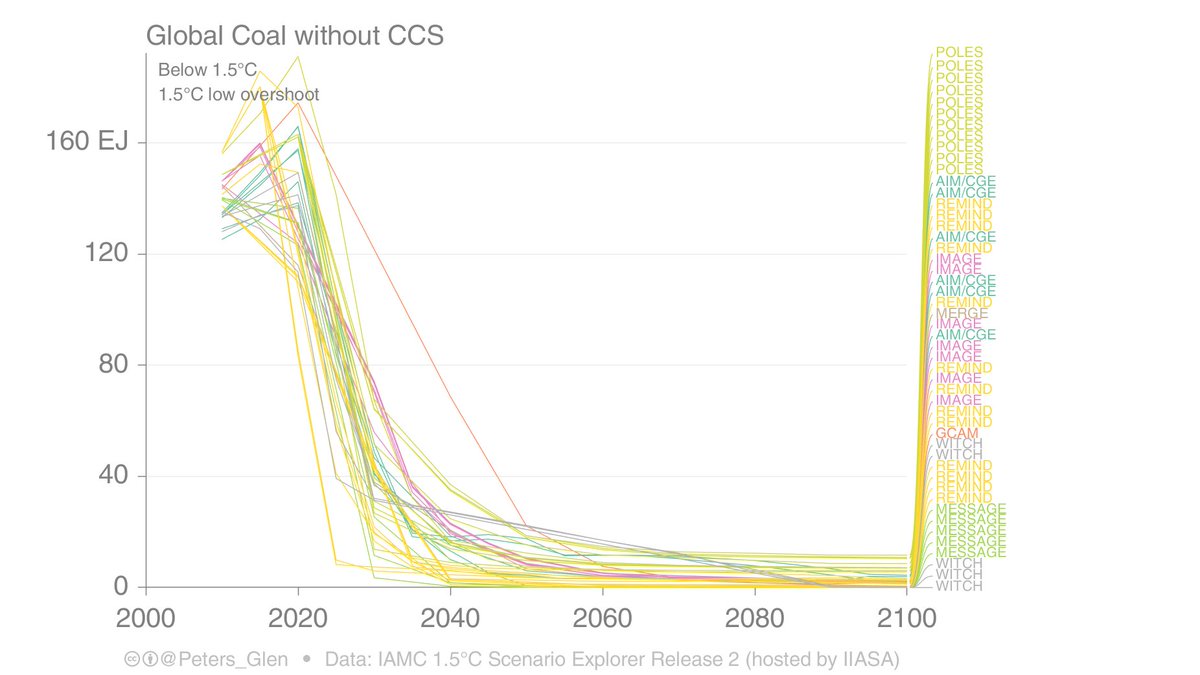
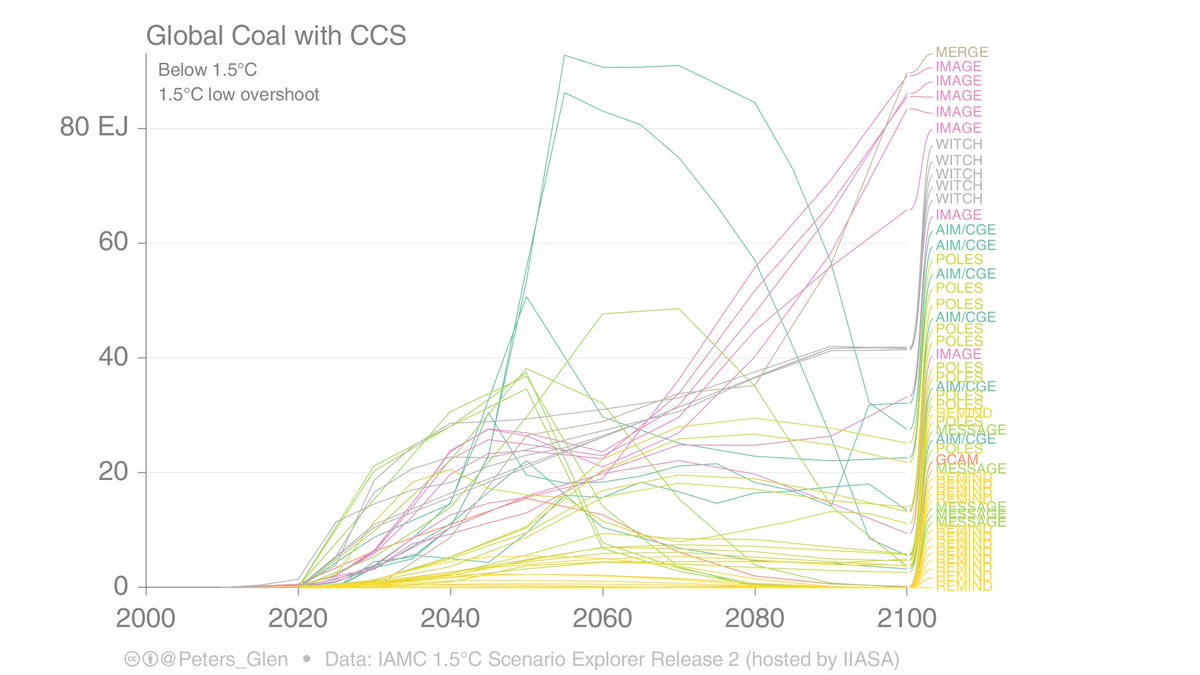
9. Coal without CCS basically goes in all models, so when you see coal in 1.5°C scenarios, it all has CCS...
So, how much CCS is feasible, & would it happen on coal?
So, how much CCS is feasible, & would it happen on coal?
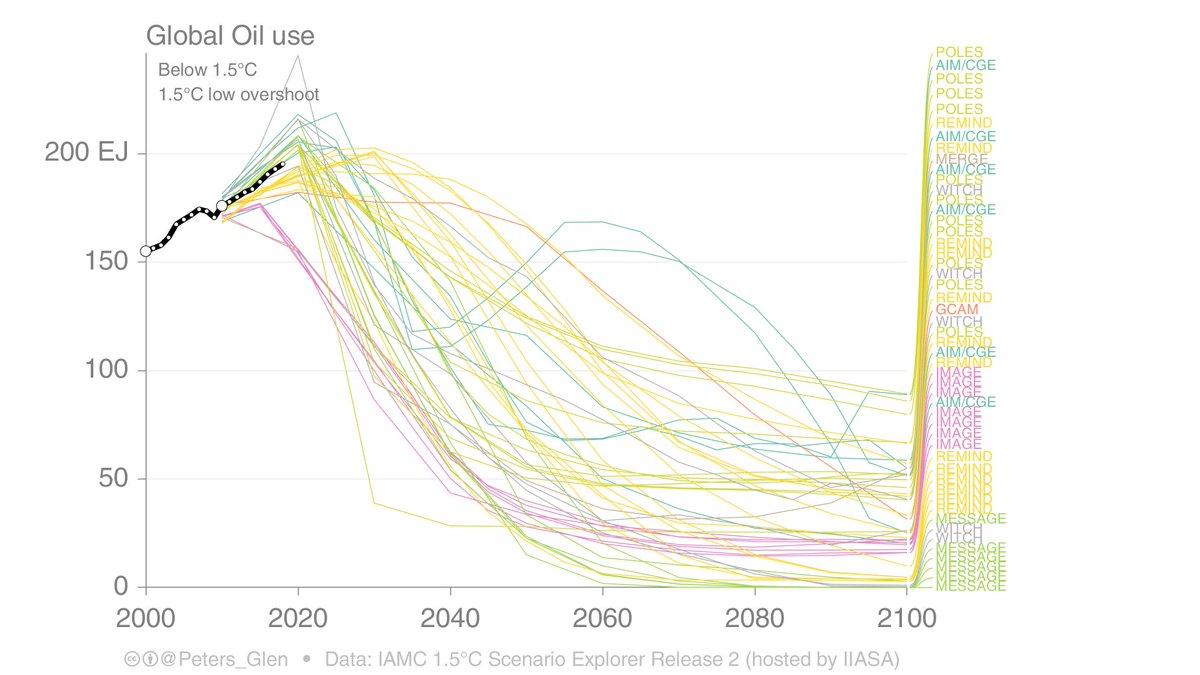
10. Oil drops away in most IAMs, but it is slow and not complete. Many scenarios have oil drop at about the same as the decline rate of existing fields. But it lingers until 2100 in many IAMs.
No BECCS scenarios have less oil.
No BECCS scenarios have less oil.
11. Gas varies widely across IAMs and scenarios, you could probably say gas will be less than today in a 1.5°C world, but how much is model and scenario dependent...
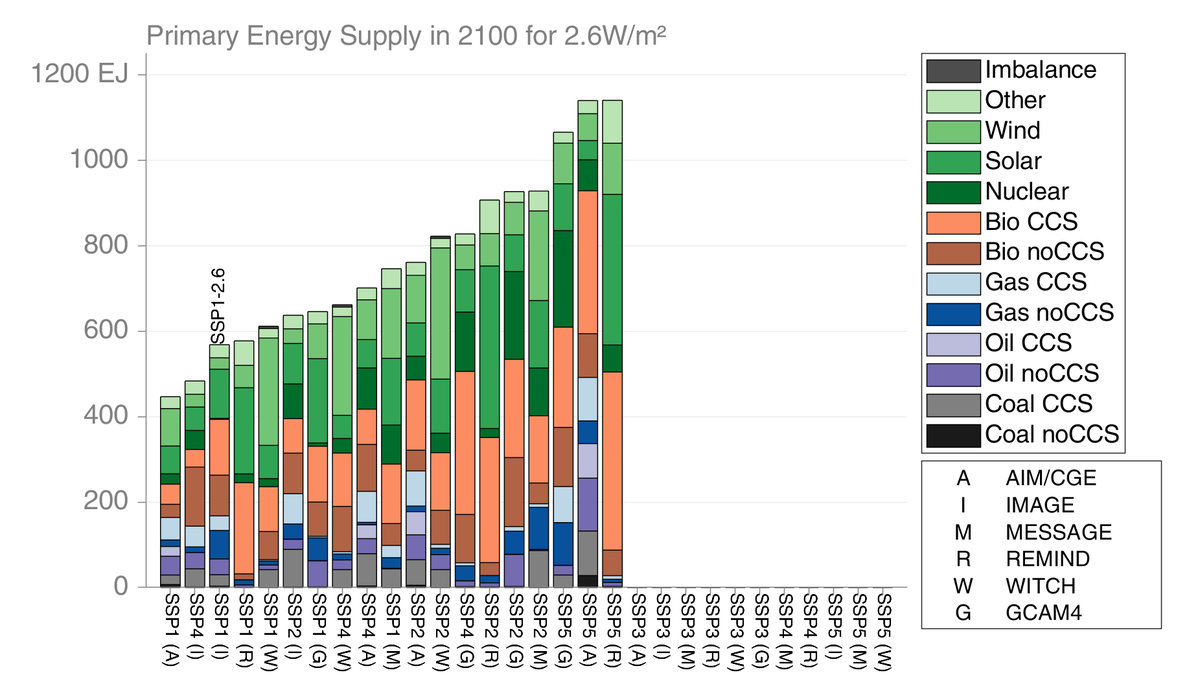
12. Here is a different style of figure, only using the SSPs, that shows the energy mix in 2°C scenarios across six IAMs. It is clear, each IAM has a different energy mix, over and above the SSP (IAM often more important than SSP).
13. There is lots we don't know.
For example, why do IAMs use so much oil & gas in particular? How does this relate to the high use of Carbon Dioxide Removal? Are IAMs too rigid in hard-to-mitigate sectors (eg aviation, steel)? What about demand? Etc.
For example, why do IAMs use so much oil & gas in particular? How does this relate to the high use of Carbon Dioxide Removal? Are IAMs too rigid in hard-to-mitigate sectors (eg aviation, steel)? What about demand? Etc.
14. There are potentially many pathways to 1.5°C that have quite different energy mixes then we see in current scenario databases.
Can these pathways come out of the existing IAMs or are they structurally bound in ways that limit diversity?
Can these pathways come out of the existing IAMs or are they structurally bound in ways that limit diversity?
15. IAMs play a quite pivotal role in framing the climate debate. They use a lot of BECCS, which means we endless discuss BECCS & other CDR, have journals, special issues, conferences. What an influence!
Imagine if no one ever joined BE with CCS...
Imagine if no one ever joined BE with CCS...
16. After those thoughts, back to work...
/end
/end
• • •
Missing some Tweet in this thread? You can try to
force a refresh