💧simon holmes à court Profile picture
Sep 2, 2020 8 tweets 3 min read Read on X
🤓 these @OpenNem charts are close to art IMHO…

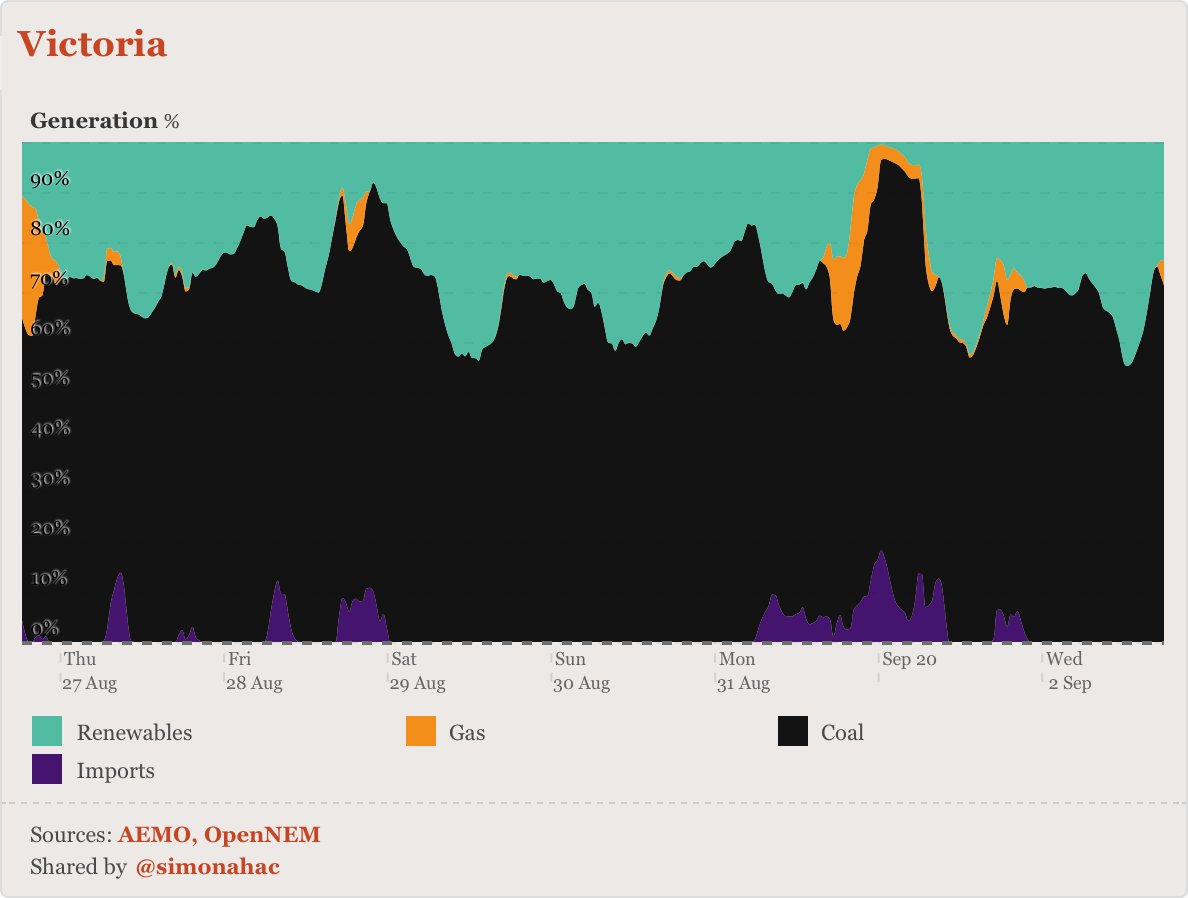
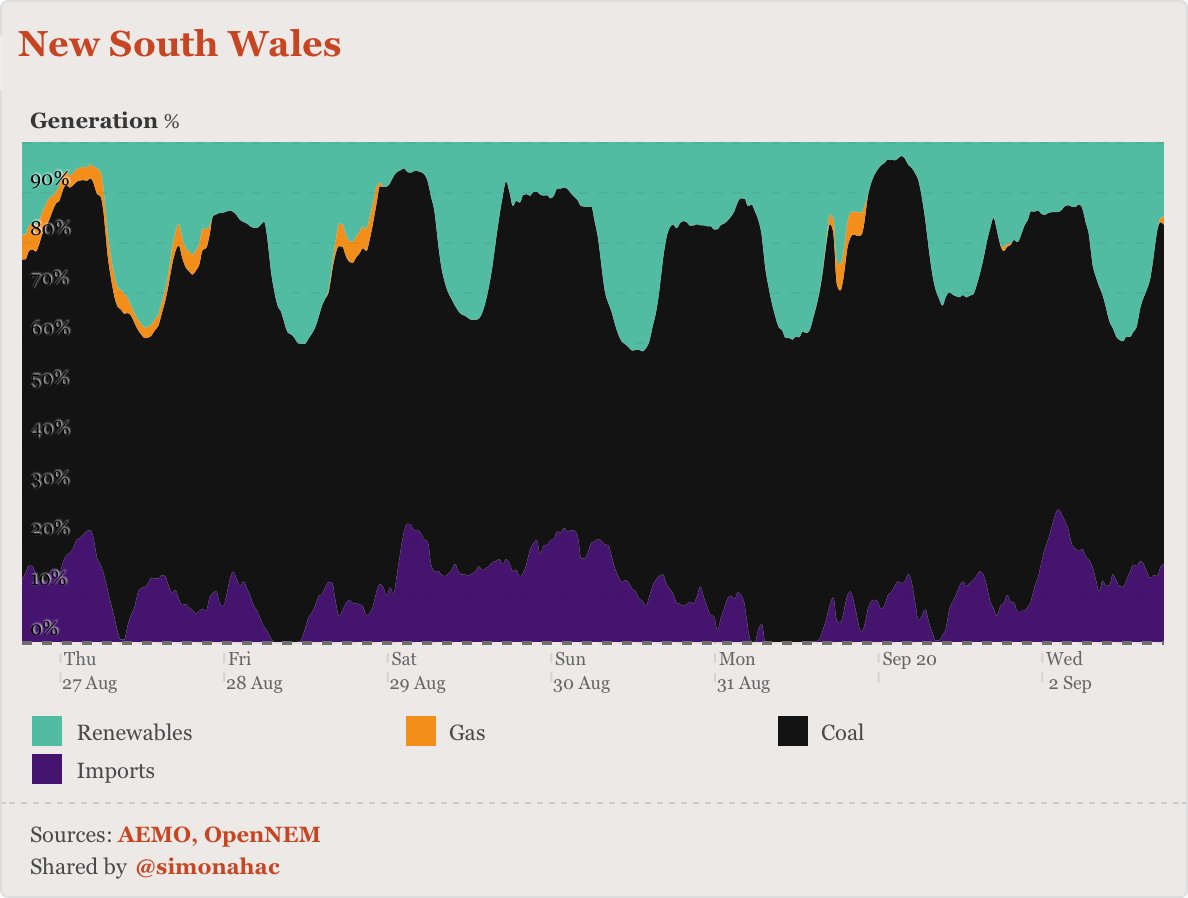
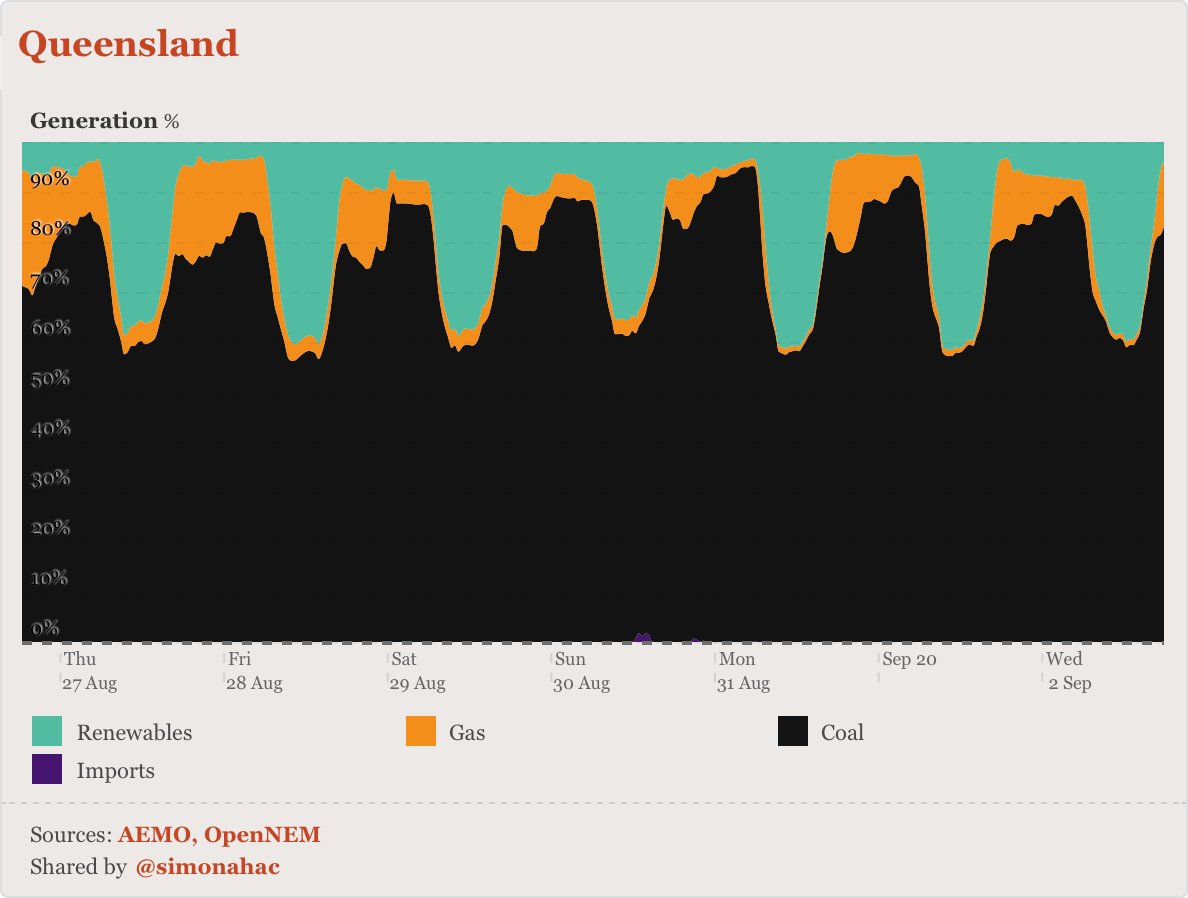
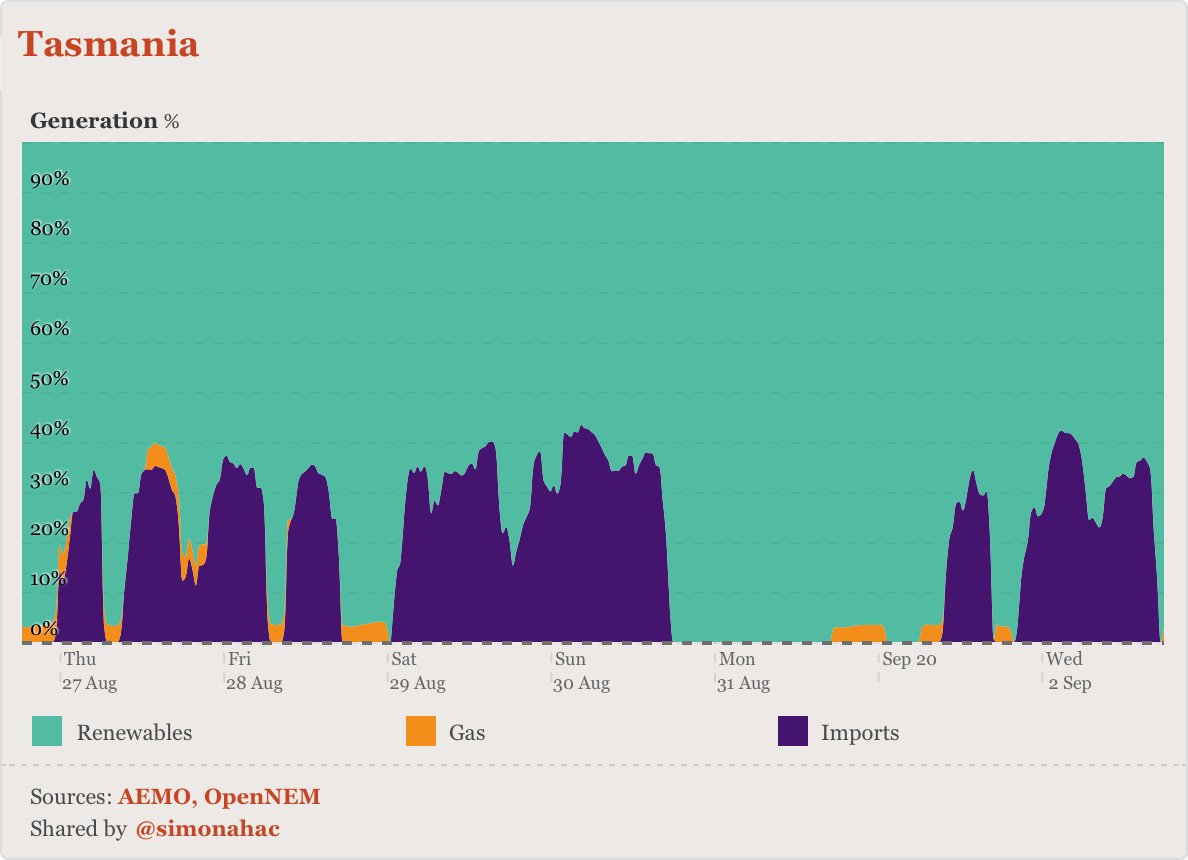
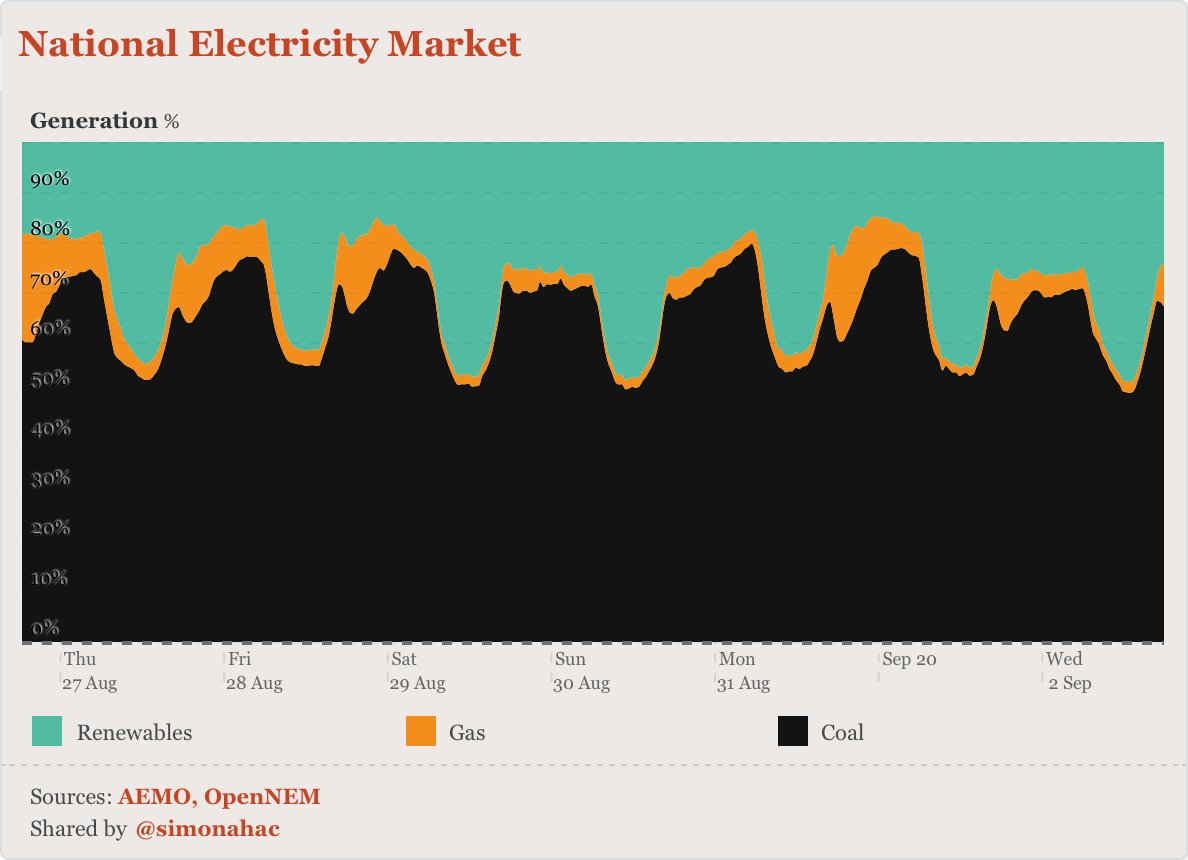
here's the *proportion* of power in the NEM from coal, renewables and gas over the past week (30 minute intervals). Image
…victoria… Image
…NSW… Image
…queensland… Image
…tasmania… Image
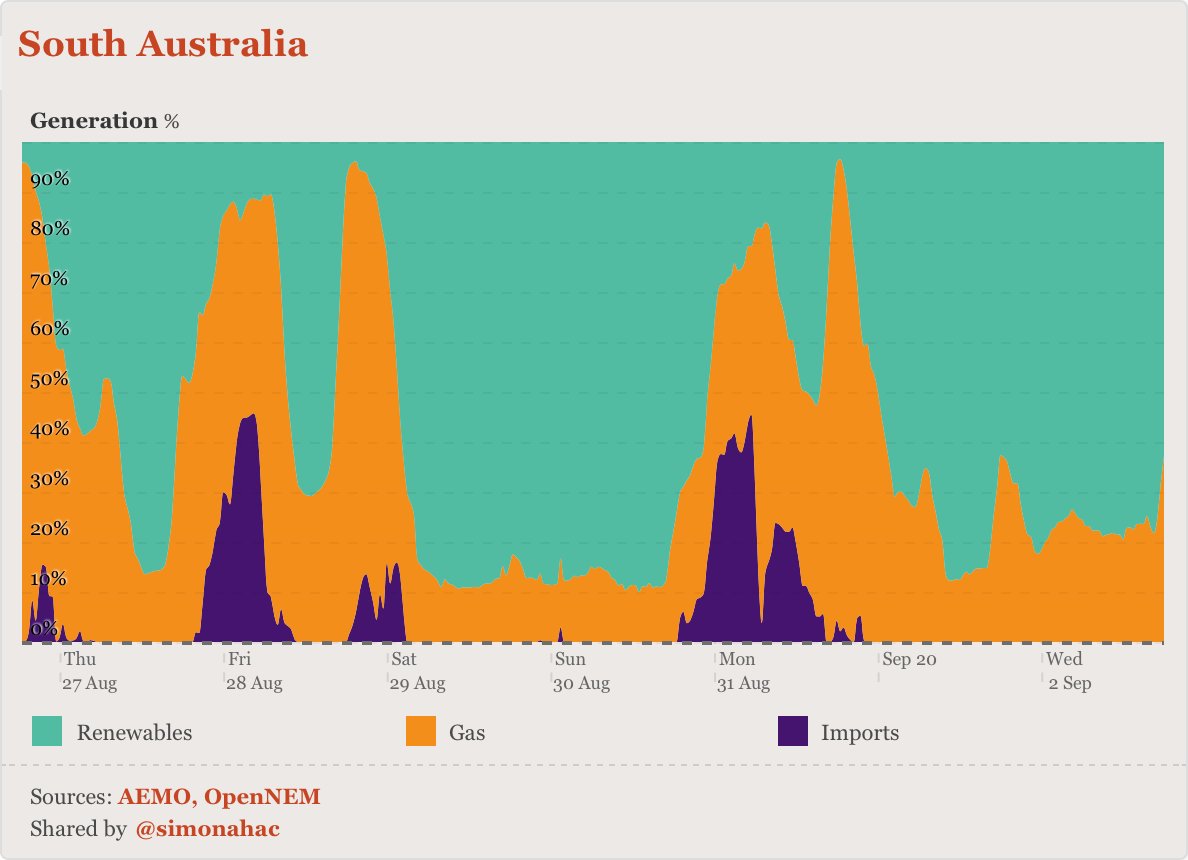
…and south australia.

(nb. by their nature, these specific charts don't show exports, and denote the proportion of each source during each interval.)

you too can visualise what's happening in our national electricity network at opennem.org.au, free, always.

enjoy! Image
ps. WA coming soon — we just need to get hold of rooftop solar data.
pps. bonus chart:

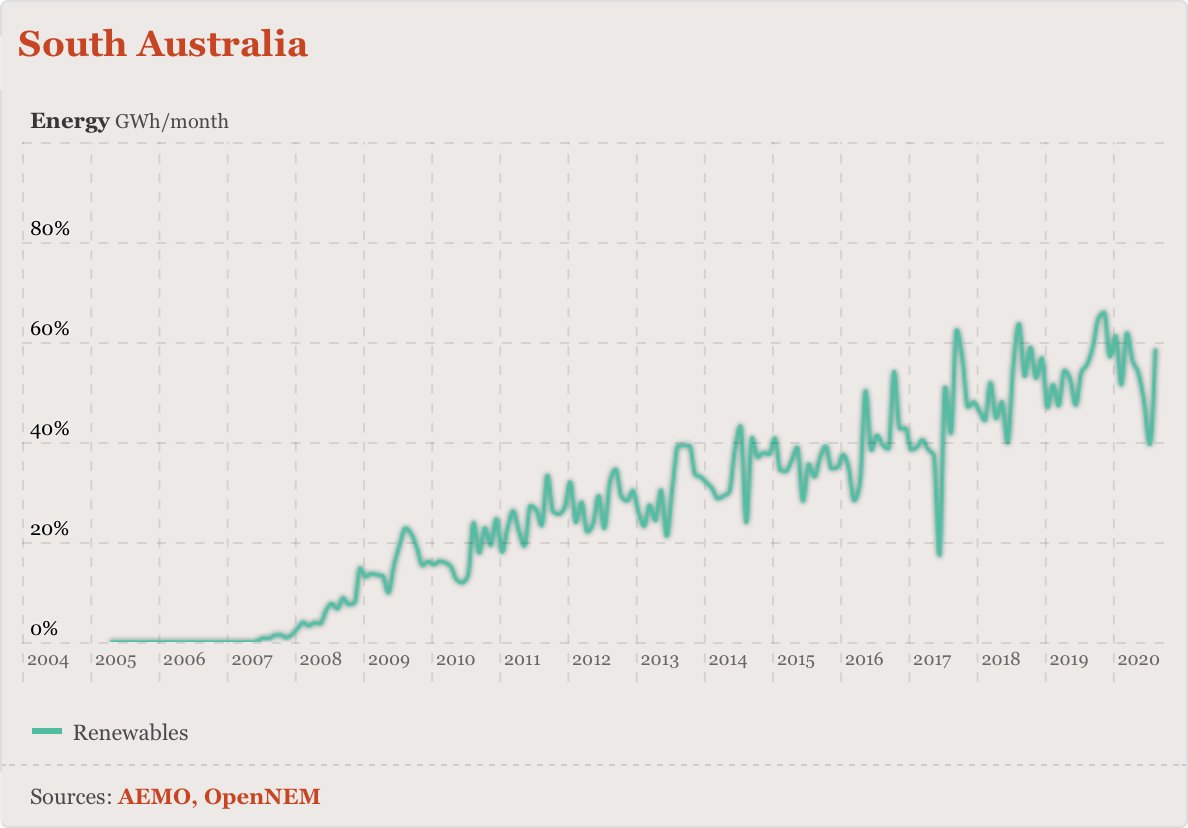
here's SA's renewable energy proportion over the last 15 years: Image

• • •

Missing some Tweet in this thread? You can try to force a refresh
 

Keep Current with 💧simon holmes à court

💧simon holmes à court Profile picture

Stay in touch and get notified when new unrolls are available from this author!

Read all threads

This Thread may be Removed Anytime!

PDF

Twitter may remove this content at anytime! Save it as PDF for later use!

Try unrolling a thread yourself!

how to unroll video
  1. Follow @ThreadReaderApp to mention us!

  2. From a Twitter thread mention us with a keyword "unroll"
@threadreaderapp unroll

Practice here first or read more on our help page!

More from @simonahac

Jul 20
hardly a week goes by without some 🪿telling me that "saudi arabia built a nuclear power station in just 8 years" or similar.

south korea built it for the UAE & it'll be 16+ years from formal announcement to project completion.

no, it was not on time & likely not on budget Image
any 🪿telling you nuclear can be built in australia in 2-3, 5, 10 or 15 years:
• ignores years of work required before construction starts
• doesn't understand IAEA's "construction" ignores _years_ of actual construction
• assumes an established regulator & warm supply chain.
Read 6 tweets
Jun 28
🤓 icymi, latest data from @EnergyInstitute is out!

this dataset has been lovingly curated since 1952, until recently by @bp_plc.

a good report, lots of charts and most exciting for energy nerds, lots of raw data!

i knocked up a few charts 🧵

energyinst.org/statistical-re…
🤓 global electricity generation by technology

gas and coal still growing, but at a slower pace than renewables.

quite likely we'll see coal and gas both peak in the next few years. Image
🤓 global nuclear and wind+solar, as energy

nuclear peaked in 2006. IEA expects that a new peak may be set in 2025. Image
Read 9 tweets
Jun 18
☢️ with the #coalition expected to announce its #nuclear plan on wednesday, here are 18 questions every diligent journalist should be seeking answers to:

🧵
1. how will dutton remove the ban?

the coalition would require control of the senate to repeal the ban, which is embedded in two acts.

the coalition hasn’t controlled the senate since 2004-2007.
2. which state(s) would dutton build the reactors in?

only VIC, NSW and QLD grids are big enough to handle a large nuclear reactor.

WA, SA and TAS grids are too small to host a GW-scale reactor.
Read 20 tweets
May 20
🤓 you'll probably hear scary claims today about "blackouts" in NSW, due to a "reliability gap".

…caused by delays with SA-NSW transmission line, a few batteries & mothballed generators.

to meet the 99.998% reliability standard, NSW needs to build more kit.

not a big deal. 🧵 Image
the eraring power station has 4 units, each 720MW. delaying closure of 1-2 units could fill the gap.

a 500MW–1GW gas generator operating <10 hours a year would also suffice. lower emissions and might be cheaper?

helpfully AEMO has provided 9 options to fill the gap: Image
small reliability gaps are forecast in VIC and SA, but far enough out that they'll likely evaporate… as they often do for this regular report.

why? because the reports show what happens if we don't do anything more than committed — and we pretty much always do.
Read 6 tweets
May 15
i attended the ‘navigating nuclear’ conference on monday in sydney.

up front: there were some high quality presentations — on issues such as health impacts, safety culture, regulatory systems. Image
…but sadly there was also some abject nonsense…
the presentation below argued that we have two options:

1. build a complex grid of wind, solar, hydro, hydrogen, batteries, pumped hydro, transmission and EVs.

2. just build nuclear and use existing powerlines.

…apparently #2 is the way to go. 🙄 Image
Read 10 tweets
Mar 21
⚛️ @abcnews's recent #FactCheck made a classic rookie error in calculating that the latest US nukes had "build times of 10.1 and 10.4 years".

depending how you count it, it took somewhere between 13.9 years and ~19 years to build them.

easy mistake to make.

let me explain… 🧵
ABC's analysis assumes the build time is the elapsed period between "construction start" and "grid connection" dates.

in the real world, a nuclear power building project begins years before "construction start" and often finishes months after "grid connection".
"construction start" is defined by the IAEA as the "the date when first major placing of concrete for the base mat of the reactor building is made."

"grid connection" is when "the plant is first connected to the electrical grid for the supply of power."

pris.iaea.org/PRIS/Glossary.…
Read 18 tweets

Did Thread Reader help you today?

Support us! We are indie developers!


This site is made by just two indie developers on a laptop doing marketing, support and development! Read more about the story.

Become a Premium Member ($3/month or $30/year) and get exclusive features!

Become Premium

Don't want to be a Premium member but still want to support us?

Make a small donation by buying us coffee ($5) or help with server cost ($10)

Donate via Paypal

Or Donate anonymously using crypto!

Ethereum

0xfe58350B80634f60Fa6Dc149a72b4DFbc17D341E copy

Bitcoin

3ATGMxNzCUFzxpMCHL5sWSt4DVtS8UqXpi copy

Thank you for your support!

Follow Us!

:(