Jason Furman Profile picture
Sep 4, 2020 4 tweets 1 min read Read on X
Updated blog with the unemployment numbers for August.

Realistic: 9.9%
Official: 8.4%
Full recall: 6.6%

piie.com/blogs/realtime…
The "Realistic" unemployment rate remains higher than the official one for two reasons:

1. 1.1m workers misclassified as employed

2. 3.7m have left labor force, more than would be expected even with the rise in unemployment.
The "Full recall" unemployment rate is a hypothetical that measures what would happen under the (wildly optimistic) scenario that all of the 5.4m added to temporary layoff went back to their jobs right away & that participation rates rose in step.

It fell to 6.6% in Aug.
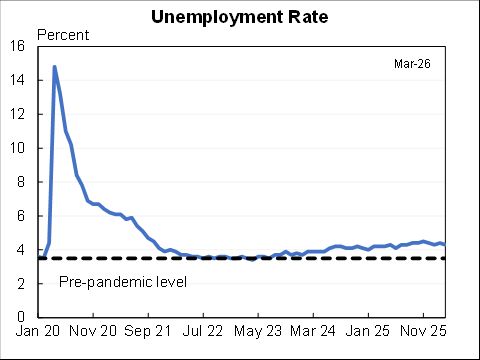
If we got/administered a vaccine today the unemployment rate would likely fall towards 6.6%. But getting the rest of the way to sub-4% unemployment would likely still be a long, hard slog. Maybe a little less long and hard than I had feared a few months ago.

• • •

Missing some Tweet in this thread? You can try to force a refresh
 

Keep Current with Jason Furman

Jason Furman Profile picture

Stay in touch and get notified when new unrolls are available from this author!

Read all threads

This Thread may be Removed Anytime!

PDF

Twitter may remove this content at anytime! Save it as PDF for later use!

Try unrolling a thread yourself!

how to unroll video
  1. Follow @ThreadReaderApp to mention us!

  2. From a Twitter thread mention us with a keyword "unroll"
@threadreaderapp unroll

Practice here first or read more on our help page!

More from @jasonfurman

Jun 11
And in big inflation news, the CPI-based Ecumenical Underlying Inflation measure was exactly 2.0% in May, consistent with the Fed's target. This is the first time it has been there since I started this concept during the inflationary episode. Image
The ecumenical measure takes the median of 21 different measures: 7 different concepts (e.g., with and without housing) over 3, 6 and 12 months--all re-meaned to match the PCE inflation that the Fed targets.

In practice it is very similar to 6-month core CPI (re-meaned). Image
I didn't share the basic data earlier. Here is core CPI, came in well below expectations in May. Image
Read 8 tweets
Jun 6
A boring jobs report, in a good way. 139K jobs added (140K private). Unemployment rate unchanged at 4.2%. Hours unchanged. Only notable deviations from steady state were participation down and unusual wage growth up. Image
Note, Federal employment continued to decline. But state and local added almost as much. Image
Here is earnings. Image
Read 6 tweets
May 2
Strong jobs report. 177K jobs added. Unemployment rate steady at 4.2% but participation rate up and U-6 down. Hours steady. A slowdown in hourly wage growth. Image
Federal employment was down a bit but state and local more than made up for it. The trend in private jobs is basically the same as total. Image
Unemployment rate very slowly drifted up for the last year and a half. Image
Read 6 tweets
Apr 30
Real GDP fell at a 0.3% annual rate in Q1.

The underlying numbers are very extreme--with an enormous increase in imports and inventories.

My preferred measure of "core GDP" a better signal, up at a 3.0% annual rate (see next) Image
Final Sales to Private Domestic Purchasers is usually a better predictor of future GDP growth.

It includes:
Personal consumption: +1.8%
Business fixed investment: +9.8%
Residential investment: +1.3%

ft.com/content/58576a…Image
And here are those "stable" parts of GDP. Image
Image
Image
Read 10 tweets
Apr 28
Wednesday's Q1 GDP # will have a lot of economic noise, a lot of measurement noise, and could generate even more political noise.

A technical🧵on one aspect: what period does it reflect?

The answer is a combo of pre- and post- 1/20 because of the weirdness of quarterly averages
When I (and most people) look at things like CPI or jobs, we look at something like a three month average. That would be growth from Dec 2024 to Mar 2025. Which is also the (geometric) average of the growth rates in Jan, Feb and Mar. It tells you what happened in those 3 months.
But GDP is not reported monthly (fortunately, would be really volatile). So the numbers are the growth from the average of Oct/Nov/Dec to Jan/Feb/Mar. If there is weak growth in Nov or Dec that lowers part of Q4 but all of Q1 so lowers overall growth.
Read 8 tweets
Apr 12
Four roughly true and important propositions about trade. Asserting not explaining here, will explain sometime:

1. The volume of trade depends, inter alia, on the magnitude of domestic and foreign tariffs:

X + M = f (US tariffs , foreign tariffs)
2. The balance of trade depends mostly on U.S. macroeconomic balances, like the budget deficit and level of business investment:

X - M = f(US macro balances)
3. Well being goes up when X + M goes up. This is both because we get the benefits of imports and also the better jobs in areas we specialize in.

4. Well being doesn't have a monotonic relationship to X - M. Too large a deficit or surplus both problems, "ideal" value depends.
Read 8 tweets

Did Thread Reader help you today?

Support us! We are indie developers!


This site is made by just two indie developers on a laptop doing marketing, support and development! Read more about the story.

Become a Premium Member ($3/month or $30/year) and get exclusive features!

Become Premium

Don't want to be a Premium member but still want to support us?

Make a small donation by buying us coffee ($5) or help with server cost ($10)

Donate via Paypal

Or Donate anonymously using crypto!

Ethereum

0xfe58350B80634f60Fa6Dc149a72b4DFbc17D341E copy

Bitcoin

3ATGMxNzCUFzxpMCHL5sWSt4DVtS8UqXpi copy

Thank you for your support!

Follow Us!

:(