
Is the rise and fall of COVID in Florida “inexplicable”?
A thread on non-pharmaceutical interventions (NPI).
alachuachronicle.com/is-the-rise-an…
1/16
A thread on non-pharmaceutical interventions (NPI).
alachuachronicle.com/is-the-rise-an…
1/16
Dr. Michael Lauzardo, Chief and Assistant Professor of the Division of Infectious Diseases and Global Medicine at UF, said, “We have seen the people modify their behavior. The use of masks, we believe, is what’s resulted in cases dropping inexplicably...”
2/16
2/16
He clarified that when people hear that reported cases are increasing, they go out less and wear masks more often.
So the hypothesis is that when cases started going up, people were more compliant about mask-wearing and also decreased their activity.
3/16
So the hypothesis is that when cases started going up, people were more compliant about mask-wearing and also decreased their activity.
3/16
Is there any evidence for this?
We used CDC charts that superimpose COVID case counts on mobility data
Mobility in Alachua County stayed nearly flat throughout the increase and decrease in COVID cases in July and early August.
4/16
We used CDC charts that superimpose COVID case counts on mobility data
Mobility in Alachua County stayed nearly flat throughout the increase and decrease in COVID cases in July and early August.
4/16
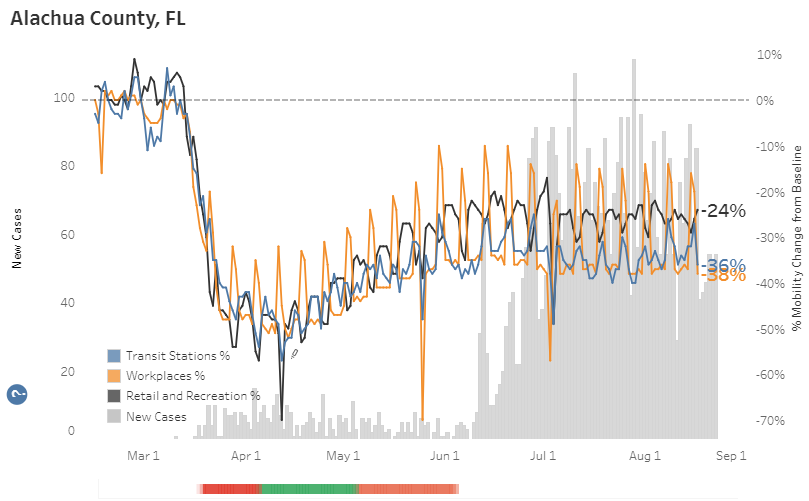
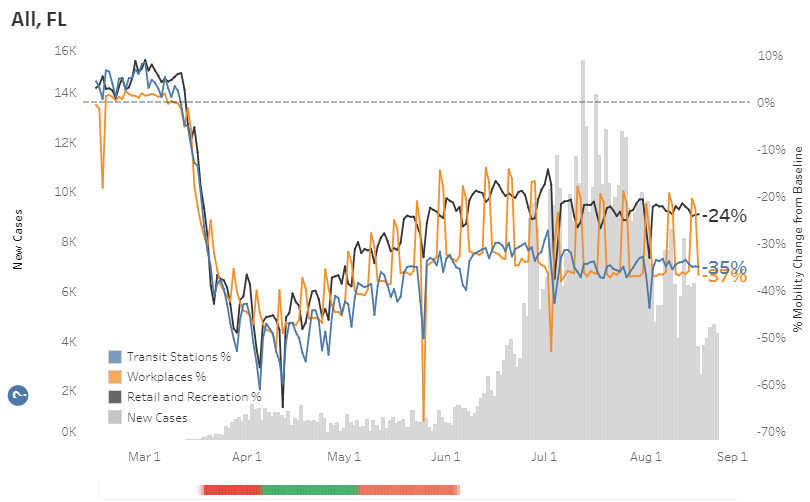
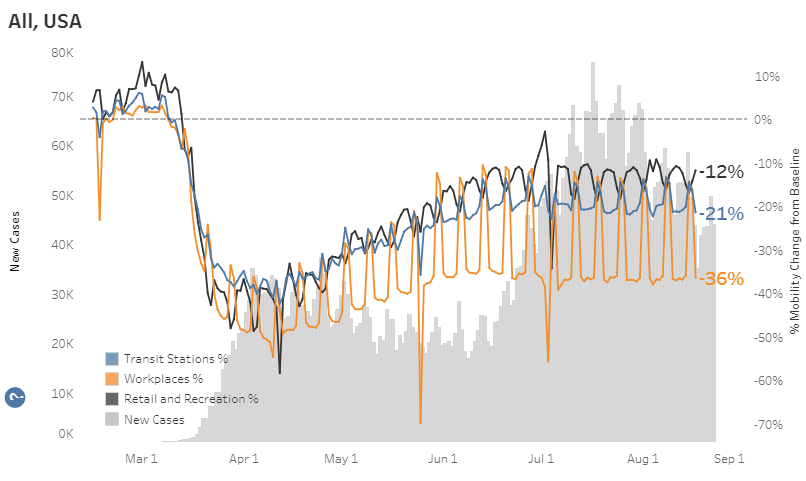
Florida saw a very slight decrease in mobility in July and August, but there is no statistically-significant relationship between cases and mobility in Alachua County, in Florida, or in the U.S. as a whole.
5/16
5/16
6/16
So changes in mobility do not explain either the rise or fall in cases. What about masks?
7/16
7/16
Alachua County implemented a face mask mandate on May 4 and has not removed it at any point. The county’s data shows high compliance since they started measuring it on July 3.
8/16
8/16
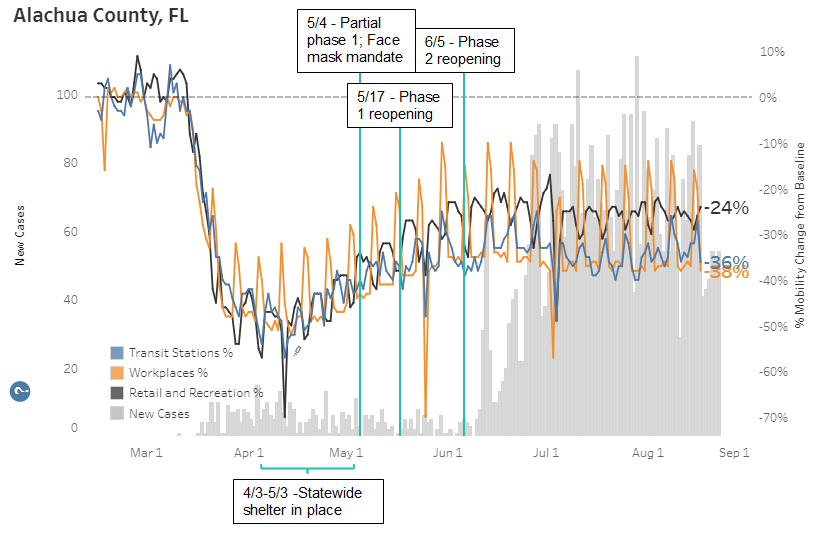
In spite of no change in mask policies, cases in Alachua County began rising in mid-June, plateaued through July and early August, then began dropping.
9/16
9/16
You can also see that the Phase 2 reopening, often blamed for the increase in cases, did not result in any increase in mobility.
10/16
10/16
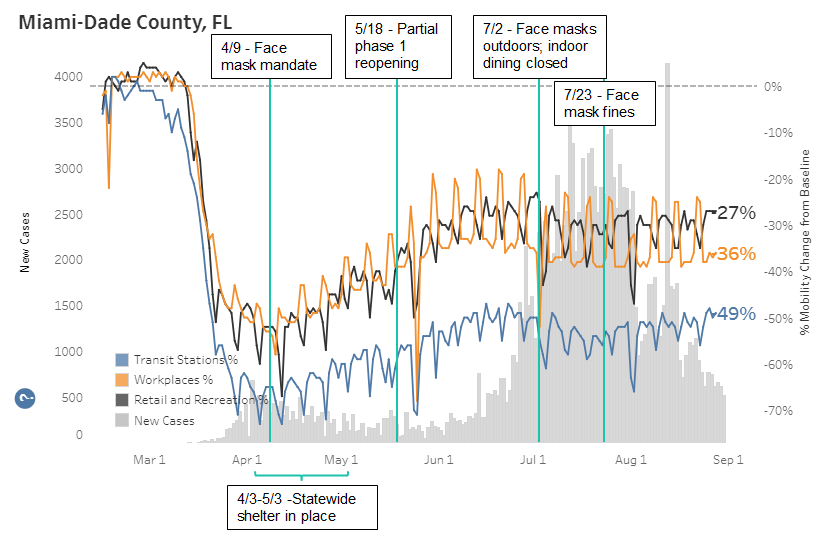
Miami-Dade implemented a mask mandate on April 9 and added an outdoor face mask mandate on July 2. They had a massive spike in cases in July without changing any policies at all, and the cases began declining in August. Miami remains in Partial Phase 1.
11/16
11/16
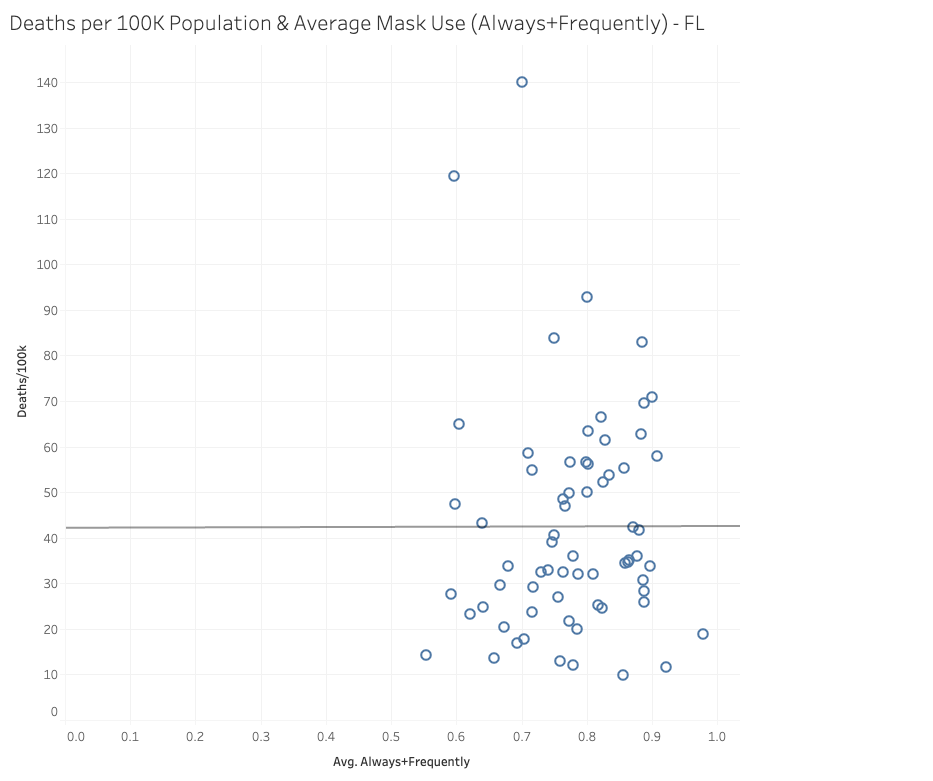
There is no relationship at all between mask use and deaths per 100k population in Florida.
12/16
12/16
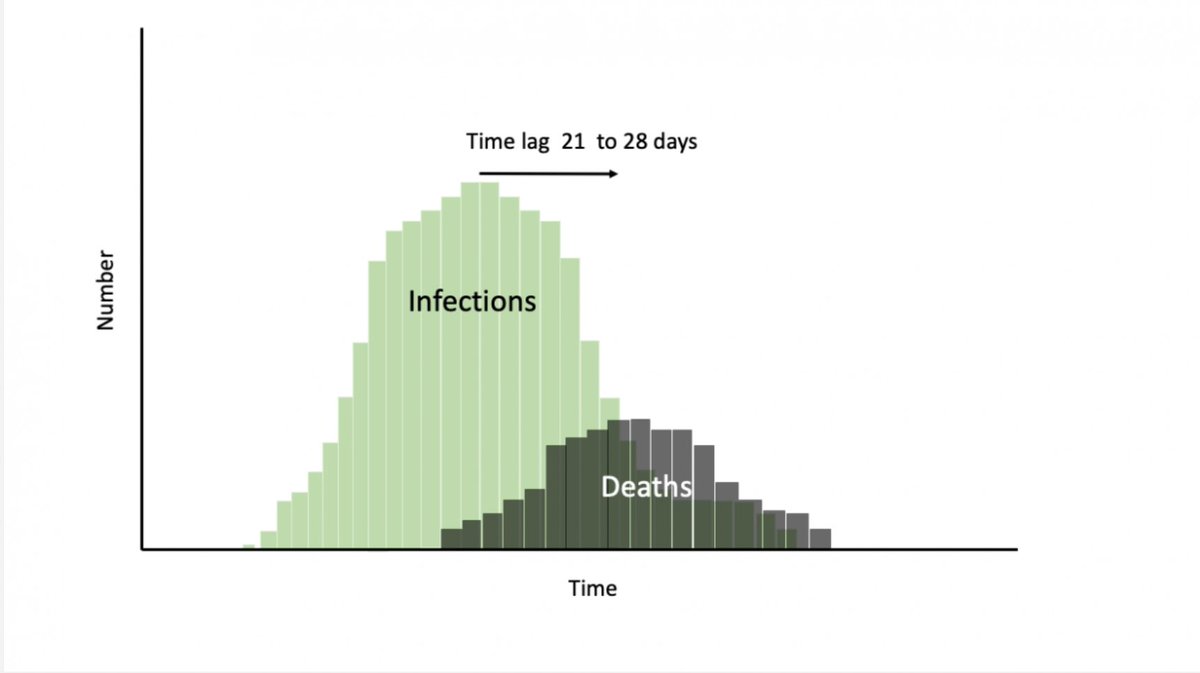
What’s inexplicable is that Lauzardo doesn’t seem to be familiar with Farr’s Law: “Farr showed that epidemics rise and fall in roughly a bell-shaped curve (a normal distribution) shape.”
13/16
13/16
The graph below shows the rise and fall of cases and deaths in Florida.
14/16
14/16
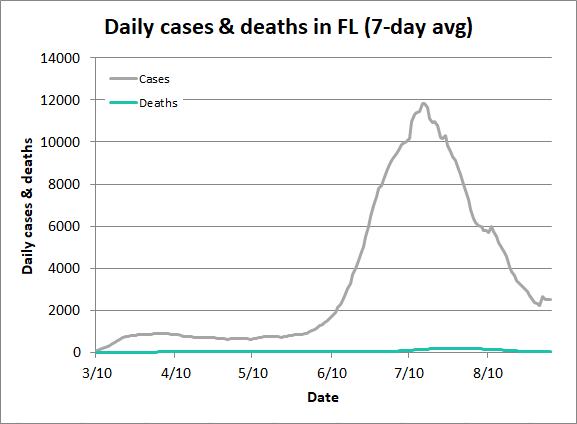
The death curve is so small that the second graph makes it 10 times bigger so you can see it. The dotted line for deaths shows the deaths that have been reported so far, but deaths reported in future weeks will fill in the dotted section.
15/16
15/16
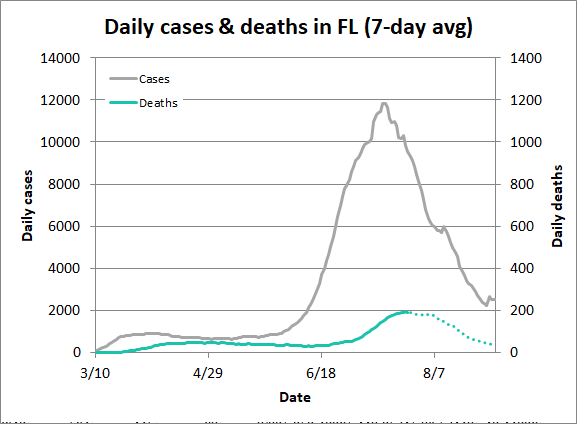
The graph above looks very similar to Farr’s law, right down to the ~21-day lag between the peaks in cases and deaths, making normal behavior of viruses a more likely explanation for the rise and fall of cases/deaths than the behavior of the population.
16/16
16/16


