
1. Did the latest @Ihme mortality forecasts making the media rounds - 410,000 deaths - seem high to you?
Yeah, me too. I wanted to understand what’s driving projections of 220K more deaths by New Years.
So, I tried to peek under the hood, as best I could.
Buckle in. A thread.
Yeah, me too. I wanted to understand what’s driving projections of 220K more deaths by New Years.
So, I tried to peek under the hood, as best I could.
Buckle in. A thread.
2. First observation: the methods really need to be easier to find and vet.
Optimally, publish all code.
At least, have every update point clearly to the technical document with full model details. Right now, the FAQ and results updates point to old model versions.
Optimally, publish all code.
At least, have every update point clearly to the technical document with full model details. Right now, the FAQ and results updates point to old model versions.
3. After some digging, I think the current IHME forecast model is described here:
medrxiv.org/content/10.110…
@Ihme: if this is the current model, every estimates update and the FAQ need to point here, and not just to the March and April preprints.
medrxiv.org/content/10.110…
@Ihme: if this is the current model, every estimates update and the FAQ need to point here, and not just to the March and April preprints.
4. So, what’s in the model?
There have been a few major renovations. The last one, I believe, was rolled out in July.
All remnants of the much-maligned mortality CurveFit were excised in the July release.
This CurveFit-ectomy was a welcome advance.
There have been a few major renovations. The last one, I believe, was rolled out in July.
All remnants of the much-maligned mortality CurveFit were excised in the July release.
This CurveFit-ectomy was a welcome advance.
https://twitter.com/CT_Bergstrom/status/1250304069119275009?s=20
5. The current approach is described as a hybrid ‘mortality spline + SEIR’ model.
Let’s have a look at the components.
Here’s the schematic from the July preprint.
I believe it’s pretty self-explanatory.
[Narrator: It isn’t.]
Let’s have a look at the components.
Here’s the schematic from the July preprint.
I believe it’s pretty self-explanatory.
[Narrator: It isn’t.]
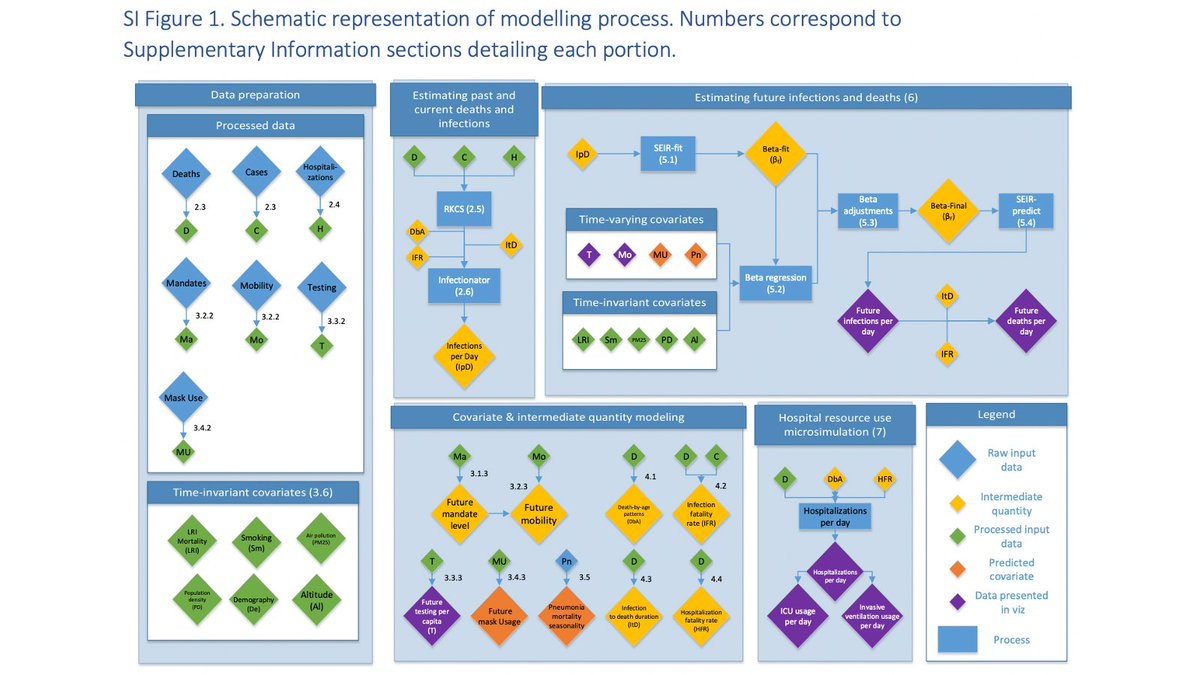
6. Step 1: Estimate smoothed mortality time series using splines.
First, cases and hospitalizations used as leading indicators to predict deaths.
Then, a 2nd model synthesizes deaths from direct observation with the death series predicted from cases & hospitalizations.
First, cases and hospitalizations used as leading indicators to predict deaths.
Then, a 2nd model synthesizes deaths from direct observation with the death series predicted from cases & hospitalizations.
7. Step 2: Back-calculate a time series on new infections from the smoothed death time series, based on …
- assumed age pattern of mortality
- assumed lag from infection to death
- assumed age-specific infection fatality rates
- assumed age pattern of mortality
- assumed lag from infection to death
- assumed age-specific infection fatality rates
8. Step 3: More back-calculation!
Here, a pretty standard deterministic SEIR model is fit to the estimated series on new infections.
Key output in this step is estimated time series on beta, the transmission rate.
[Aside: yep, this is a LOT of estimates on estimates ...]
Here, a pretty standard deterministic SEIR model is fit to the estimated series on new infections.
Key output in this step is estimated time series on beta, the transmission rate.
[Aside: yep, this is a LOT of estimates on estimates ...]
9. Step 4: It’s all about that beta.
Here’s the heart of the projection model: a linear regression of beta on a bunch of covariates, including several time varying ones:
- social distancing mandates
- changes in mobility
- testing per capita
- mask use
- pneumonia seasonality
Here’s the heart of the projection model: a linear regression of beta on a bunch of covariates, including several time varying ones:
- social distancing mandates
- changes in mobility
- testing per capita
- mask use
- pneumonia seasonality
10. Step 5: Make forward projections of the predictors, which leads to forward projections of beta. These are then plugged into the SEIR model to produce forecasts of all the other outcomes including cases and deaths.
11. So, this is the key: projections for the next four months depend on projections of the independent variables.
In the main projection, daily deaths rise from <900 now to almost 2900 by December 1.
What in the model drives things to get much worse?
In the main projection, daily deaths rise from <900 now to almost 2900 by December 1.
What in the model drives things to get much worse?

12. It’s not behavior.
The main projection expects distancing behavior to improve in response to a worsening epidemic. It’s the purple dotted line diving down in the figure, meaning reduced contacts.
It’s not mask use, which is held constant ...
…nor testing, which goes up.
The main projection expects distancing behavior to improve in response to a worsening epidemic. It’s the purple dotted line diving down in the figure, meaning reduced contacts.
It’s not mask use, which is held constant ...
…nor testing, which goes up.

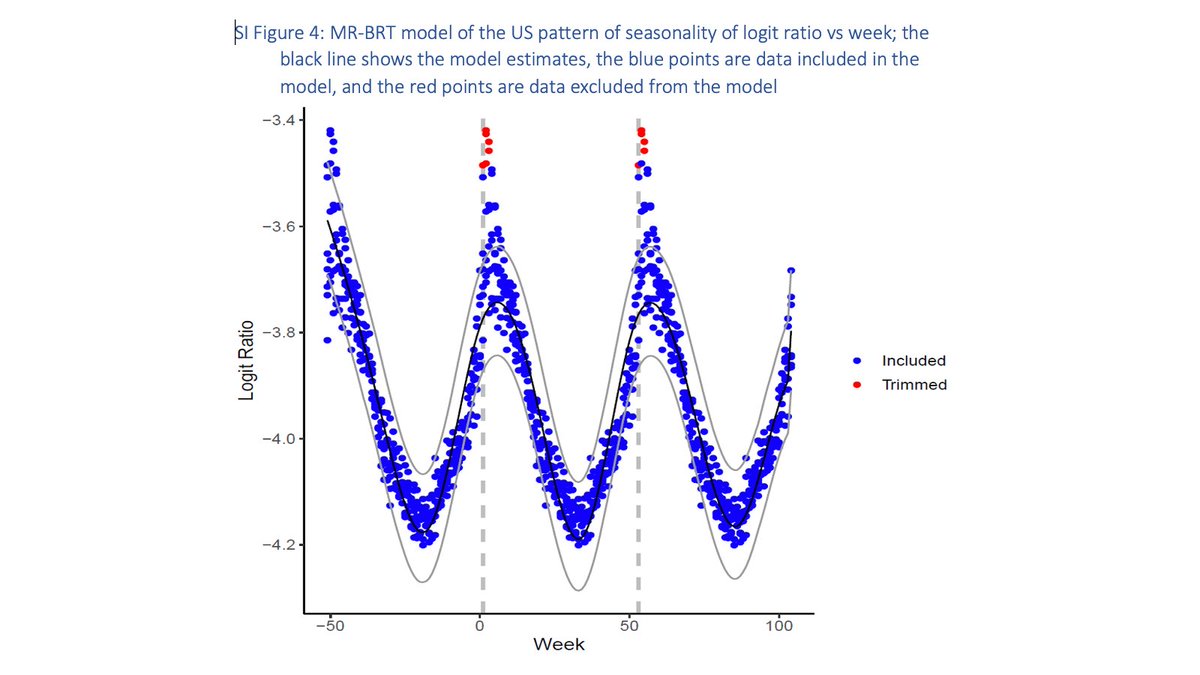
13. Which brings us to seasonality.
Seasonality is captured using weekly, state-specific vital statistics data on pneumonia mortality from 2013 to 2019.
So, as far as I can surmise, the estimated rise from 900 to 2900 daily deaths derives entirely from this seasonal effect.
Seasonality is captured using weekly, state-specific vital statistics data on pneumonia mortality from 2013 to 2019.
So, as far as I can surmise, the estimated rise from 900 to 2900 daily deaths derives entirely from this seasonal effect.
14. So, hoping @Ihme can confirm whether I've got all this right.
I’ll leave it to others to weigh in on the strength of evidence for seasonal effects on SARS-CoV-2 transmission.
Meantime, I have some suggestions for things that @Ihme could do to elicit constructive input.
I’ll leave it to others to weigh in on the strength of evidence for seasonal effects on SARS-CoV-2 transmission.
Meantime, I have some suggestions for things that @Ihme could do to elicit constructive input.
15. Make it easier to find these methods. They should be one click away from the forecasts here:
covid19.healthdata.org/united-states-…
Publish the forward projections of all predictors. The forecasted trends are driven by these. People need to see them.
covid19.healthdata.org/united-states-…
Publish the forward projections of all predictors. The forecasted trends are driven by these. People need to see them.
16. Provide more scenario analyses that allow some unpacking of the forecasts.
What if the expected effects of seasonality are less pronounced than in the base model?
How about running the best-fitting predictive model that excludes seasonal effects, for comparison?
What if the expected effects of seasonality are less pronounced than in the base model?
How about running the best-fitting predictive model that excludes seasonal effects, for comparison?
17. Bottom line: This model is getting lots of attention, from the public and (presumably) policy-makers.
Trust in science and public health has been badly damaged during this pandemic.
Transparency and good communication are essential to any hope for a science-driven response.
Trust in science and public health has been badly damaged during this pandemic.
Transparency and good communication are essential to any hope for a science-driven response.
18. Disclosure: There are IHME doubters and disciples. I’m neither. I am a long-time ally of the GBD, which is vital work that's improved by transparency and honest criticism. In my view the IHME COVID-19 models don't yet meet that standard, but I'd like to see them to get there.
I want to give credit to @IHME_UW for being responsive to some of the questions and criticism in this thread. They’ve developed an explainer thread to address these and other points, and invited further comments and suggestions. A good place to start:
https://twitter.com/ihme_uw/status/1304525932640657409?s=21
• • •
Missing some Tweet in this thread? You can try to
force a refresh


