New @CAPolicyLab Report:
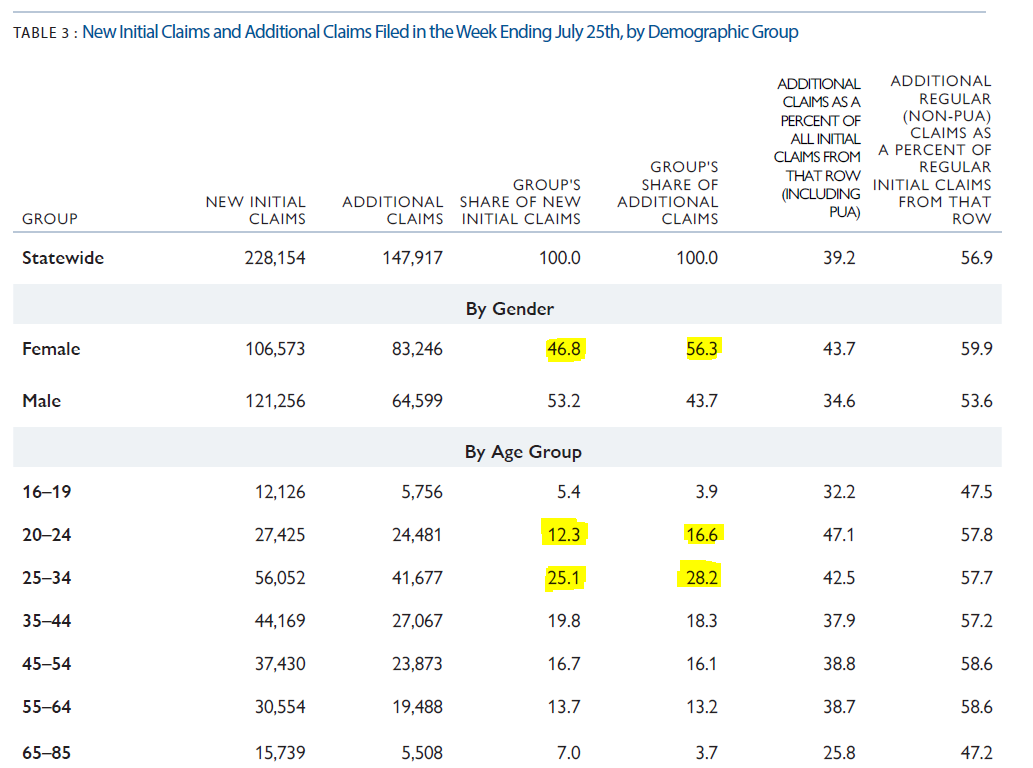
Me, @TillvonWachter, @alexbellecon & Geoff Schnorr take a deep dive into the recent #UI claims data to shed some light on what’s actually happening in CA’s labor market.
capolicylab.org/publications/s…
Thread --> (1/13)
Me, @TillvonWachter, @alexbellecon & Geoff Schnorr take a deep dive into the recent #UI claims data to shed some light on what’s actually happening in CA’s labor market.
capolicylab.org/publications/s…
Thread --> (1/13)
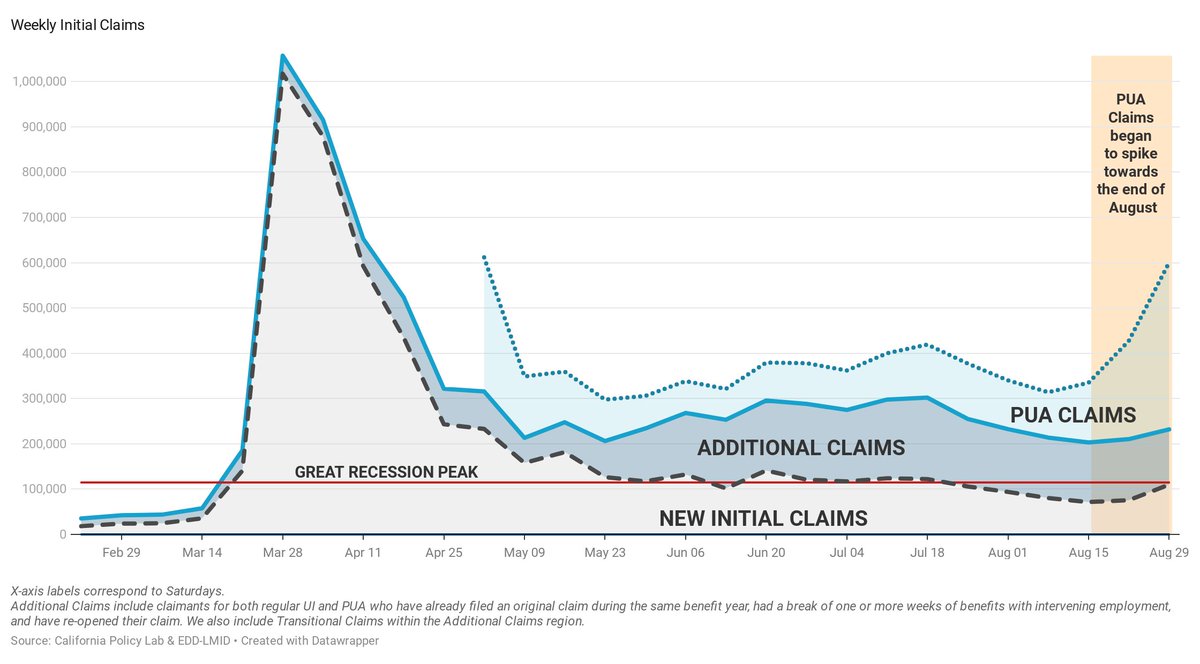
In late August, initial claims for PUA skyrocketed, while EDD expressed concerns of a surge in fraudulent PUA claims. There was also a slight increase in initial claims for regular UI.
BUT...
Prior to this, CA saw 5 consecutive weeks of a decrease in new initial claims. (2)
BUT...
Prior to this, CA saw 5 consecutive weeks of a decrease in new initial claims. (2)
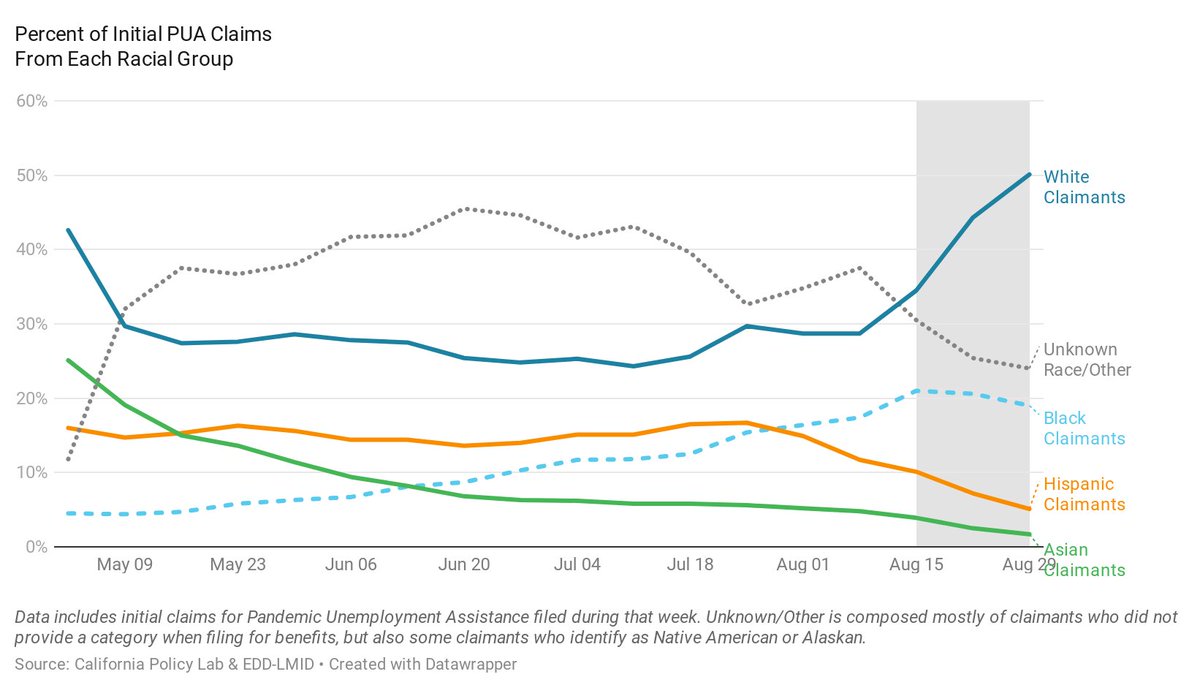
Coinciding with this surge in initial PUA claims was a change in the demographic profile of PUA claimants- Recent claimants are more likely to be male, white, and self-employed than earlier PUA claimants - whether or not this is driven by fraudulent claims isn’t totally clear (3) 
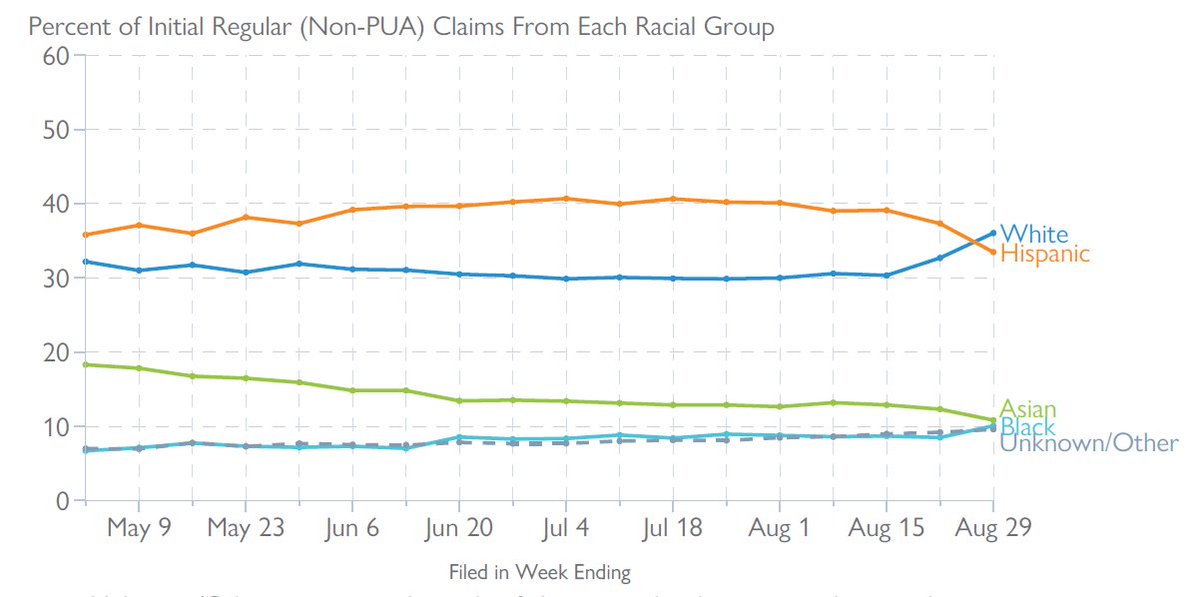
However, there has also been a similar shift in the profile of *regular* UI claimants - trends which are less likely to be contaminated by fraudulent claims. This may signal that the labor market crisis is finally spreading to those previously insulated from the recession. (4) 
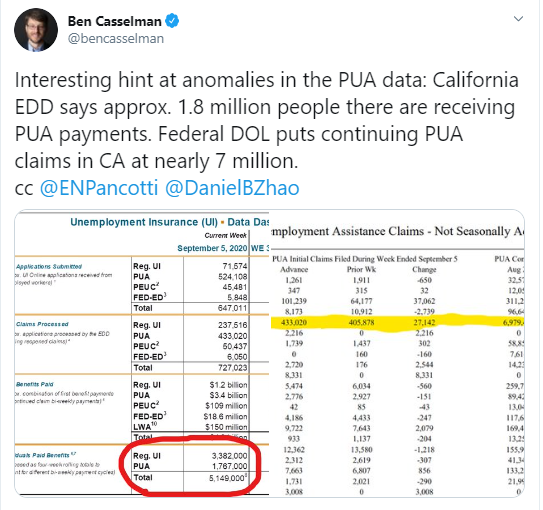
A lot of people (@BenCasselman, amongst others) have noticed a dramatic rise in continuing claims from CA seen in DOL’s weekly reports. Our report spends some time laying out what exactly those numbers do and don’t mean, and break down what’s been driving this trend. (5) 
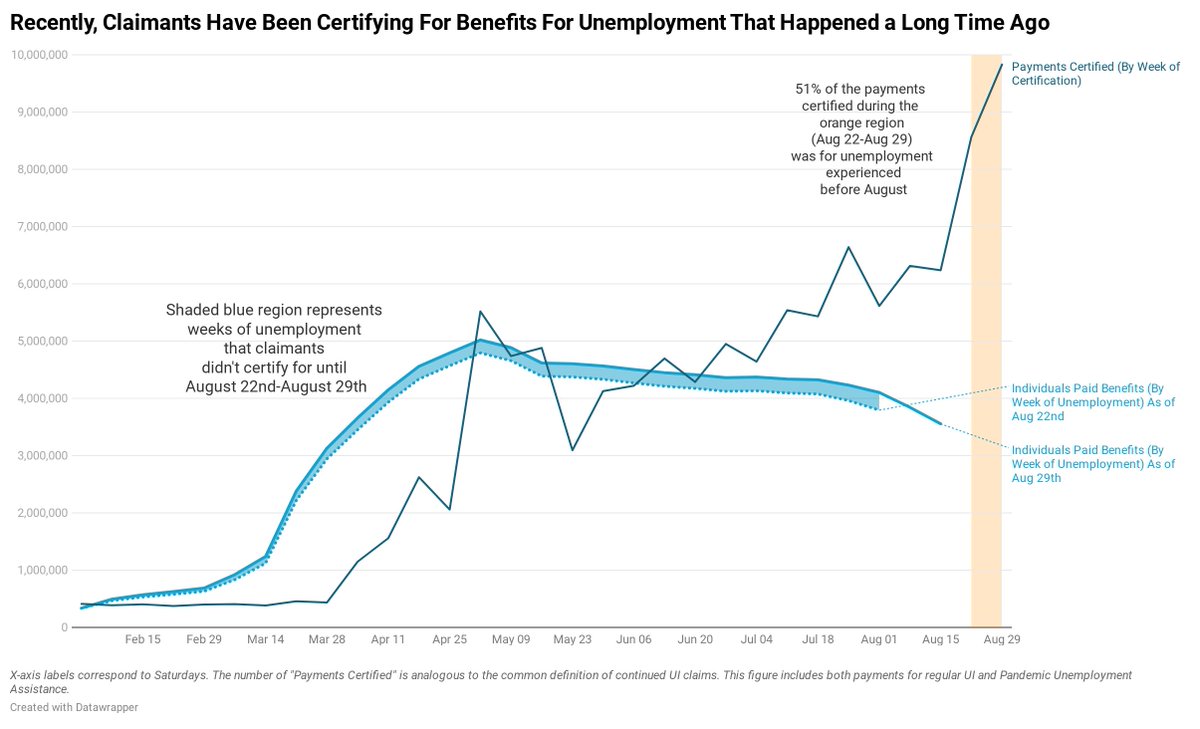
DOL’s Cont. Claims #'s report the # of weeks of payments processed in a given week. This is analogous to the dark blue line - shooting upwards sharply in late Aug. But notice the orange line - the number of Individuals certifying each week, has stayed flat. How can this be? (6) 
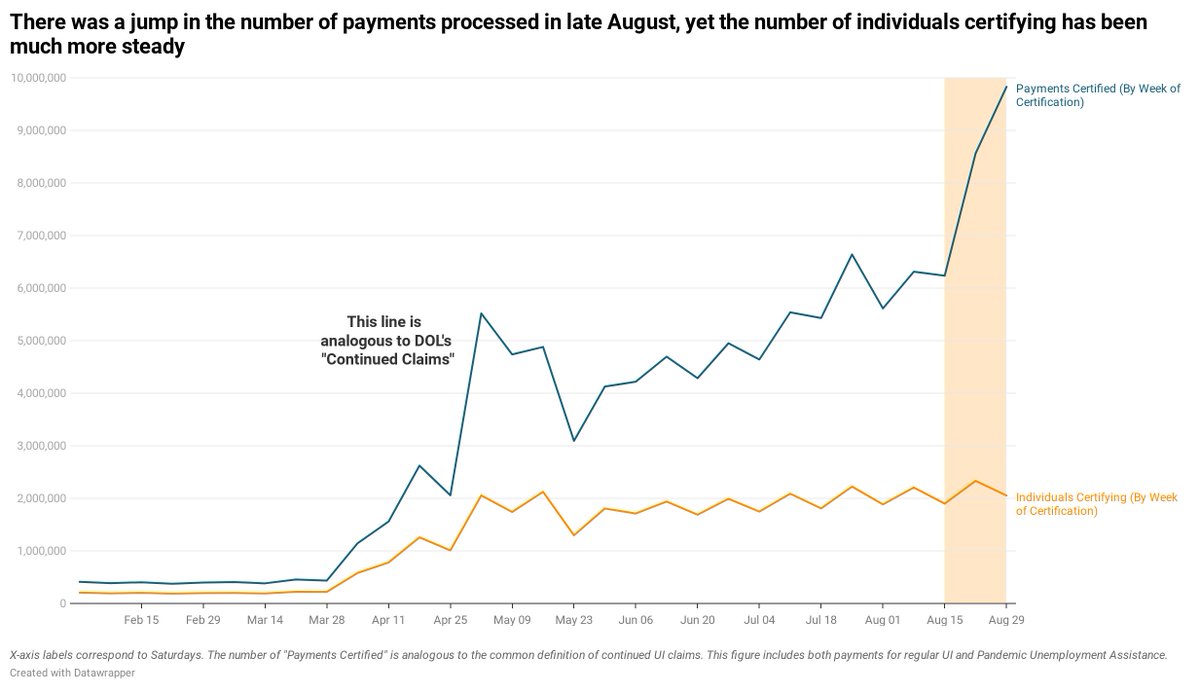
While there was a surge in new claims in late August, the recent spike in payments is instead driven by claimants who just recently filed (and certified for the first time) but are now certifying for *multiple* weeks of benefits, often back to the early stages of the crisis. (7) 
Note that this is a *new* development. While some claimants have been making retroactive claims throughout the crisis, the average number of payments certified per claimant each week suddenly jumped in August - but interestingly, only for PUA claimants. (8) 
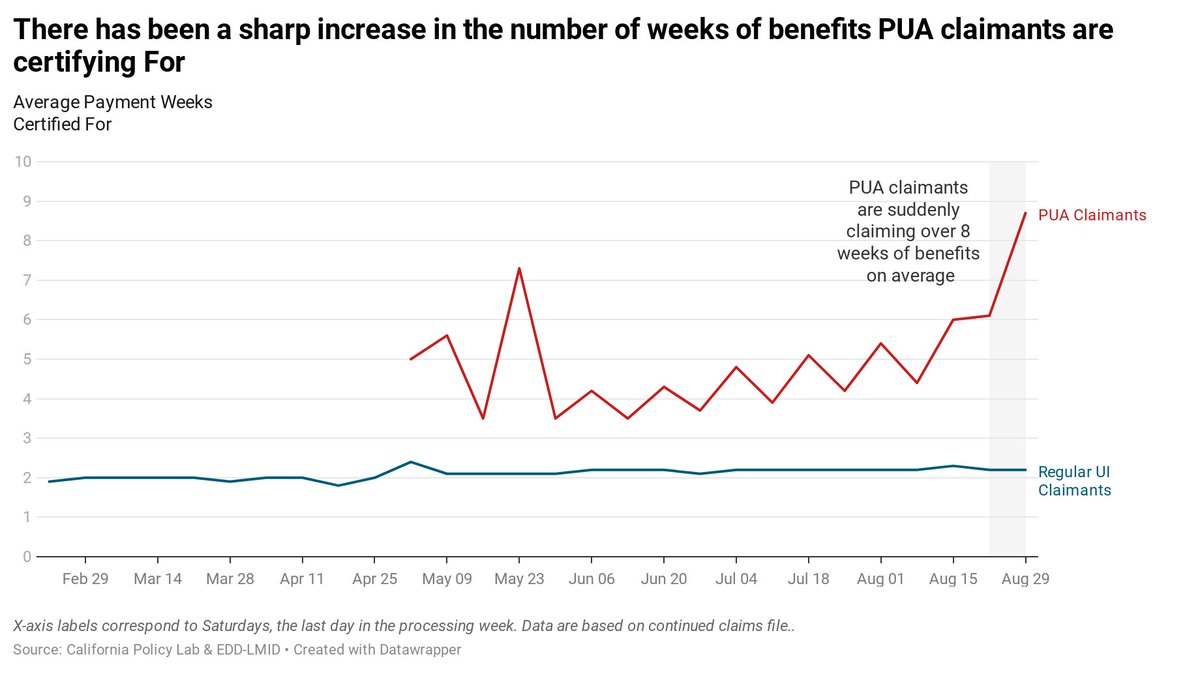
So, while the increase in new initial PUA claimants didn’t actually do much to increase the # of claimants receiving benefit payments, the fact that they’re receiving *many* more payments per person than before gives us the huge spike seen in the continued claims numbers. (9)
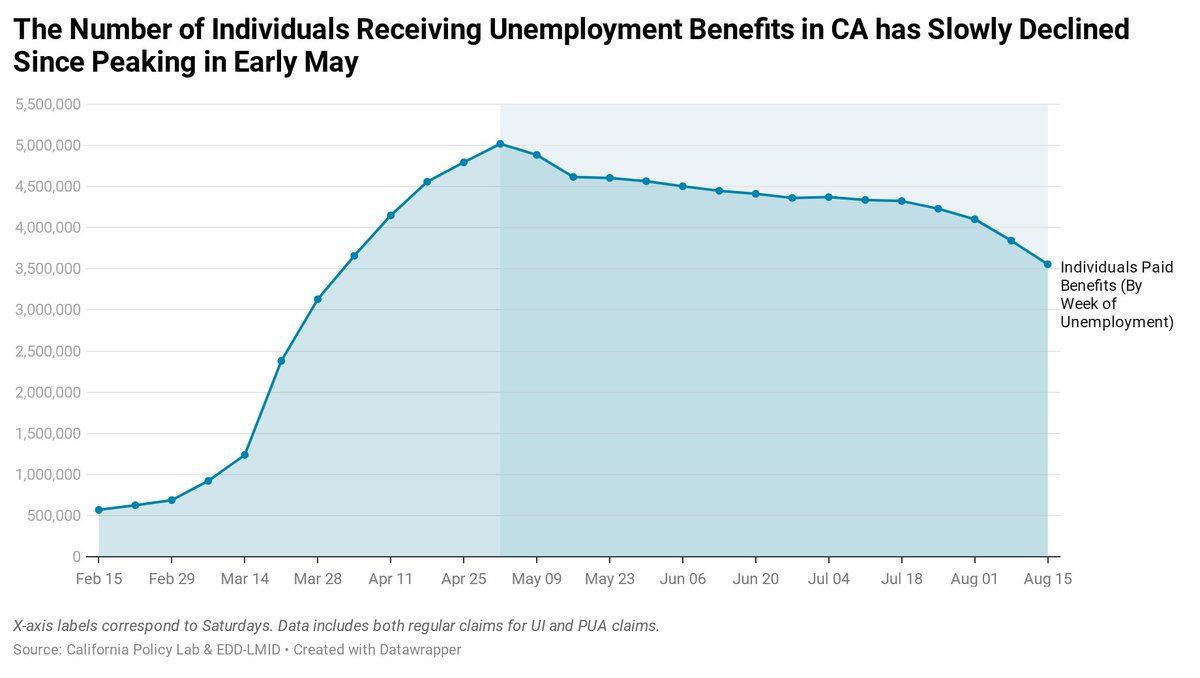
A more accurate picture of the labor market is our measure of individuals receiving benefits for unemployment *experienced in that given week*. This measure is more robust to retroactive claims, and indicates that the # of people currently on UI has been falling since May. (10) 
We also measure ~EXITS~ from UI. We define exits as missing 2 weeks of certifications in a row (after having previously certified). We find exit rates are much lower among PUA claimants, and higher among those who expected to be recalled to work by their employer. (11) 
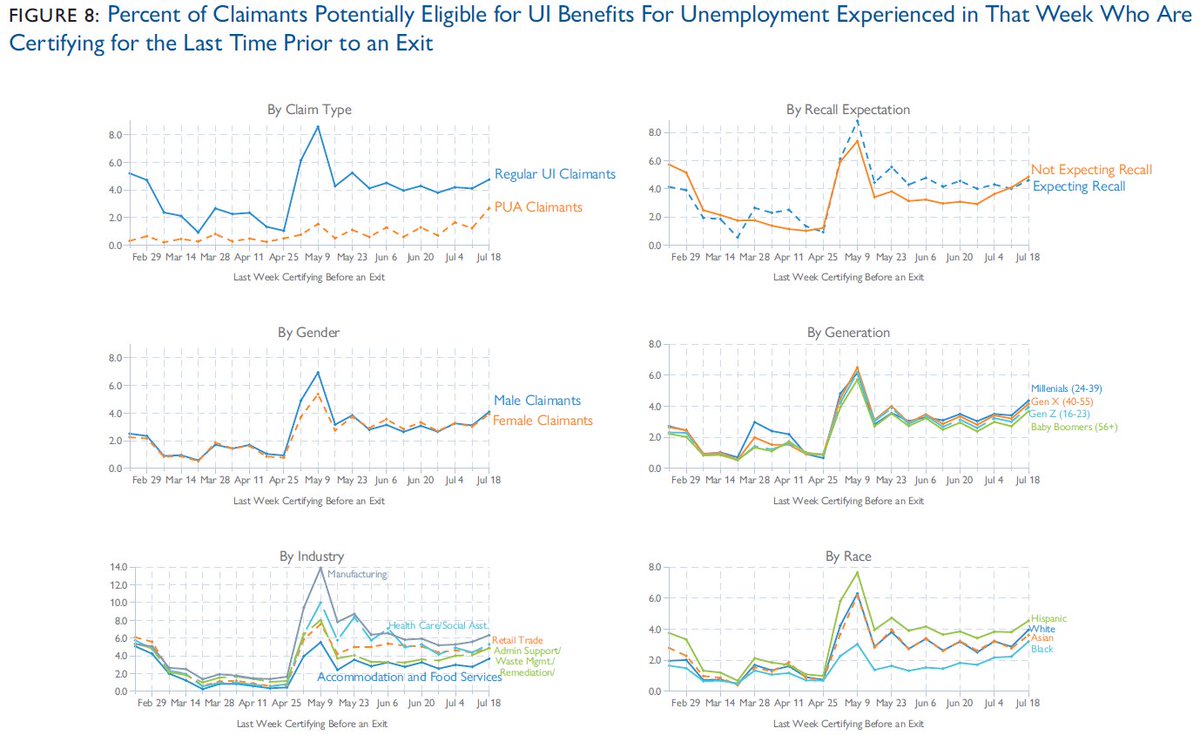
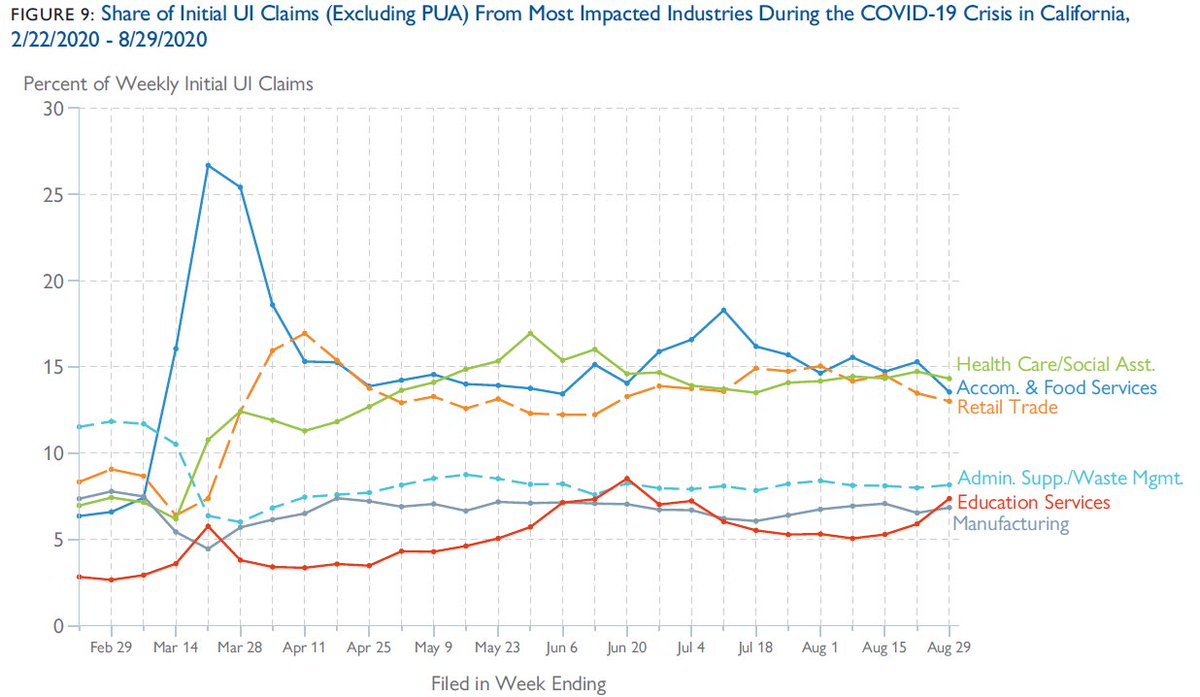
Our report dives deeper into the data in a bunch of different ways, but one interesting finding was seeing a recent, clear increase in Initial Claims from the Education Services industry, shown below in the red line: (12) 
Take a look at the full series of reports here:
capolicylab.org/california-une…
(13/13)
cc’ing some UI/Policy people+ #EconTwitter
@TheStalwart @EricMorath @sechaney @paulgp @kevinrinz @ElizaForsythe @keds_economist @ernietedeschi @jc_econ @enpancotti @p_ganong @Jstein_WaPo @arindube
capolicylab.org/california-une…
(13/13)
cc’ing some UI/Policy people+ #EconTwitter
@TheStalwart @EricMorath @sechaney @paulgp @kevinrinz @ElizaForsythe @keds_economist @ernietedeschi @jc_econ @enpancotti @p_ganong @Jstein_WaPo @arindube
+ few other policy/econ people who may be interested
@modeledBehavior @margotroosevelt @josheidelson
@jimtankersley @katedavidson @missRyley @sdonnan @JordanChariton @hshierolz @JHWeissman
@dylanmatt @mattyglesias @jbarro @neil_irwin @noahpinion @ryanlcooper
@modeledBehavior @margotroosevelt @josheidelson
@jimtankersley @katedavidson @missRyley @sdonnan @JordanChariton @hshierolz @JHWeissman
@dylanmatt @mattyglesias @jbarro @neil_irwin @noahpinion @ryanlcooper
• • •
Missing some Tweet in this thread? You can try to
force a refresh


