Not going to try and parse the latest numbers; just read Ernie Tedeschi. One thing we should be aware of, however, is that economic numbers going into the election will be historically uninformative 1/
The problem is that we're living on Covid time, and things change so fast that normal data are vastly out of date compared with where we are 2/
The final pre-election employment report will be released early next month, but it will reflect data collected *last week* — ie, give almost no sense of where the job market is in the weeks before Election Day 3/
The GDP report on Oct. 29 will, as I understand it, reflect average GDP for the 3rd quarter, which roughly means growth from May-August, which we know was fast as the economy partly snapped back from lockdown; but we also suspect that growth has slowed a lot since then 4/
So we'll be going into the election with official data that, through nobody's fault, tells us very little about what's really going on 5/
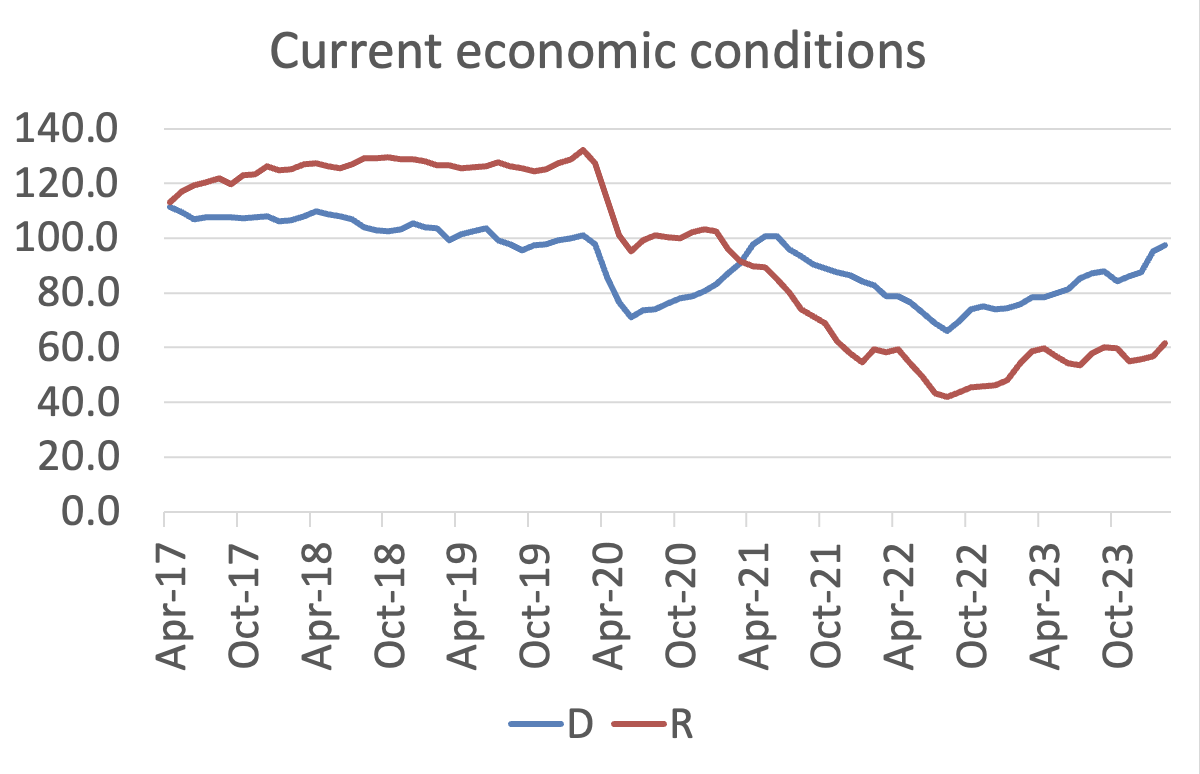
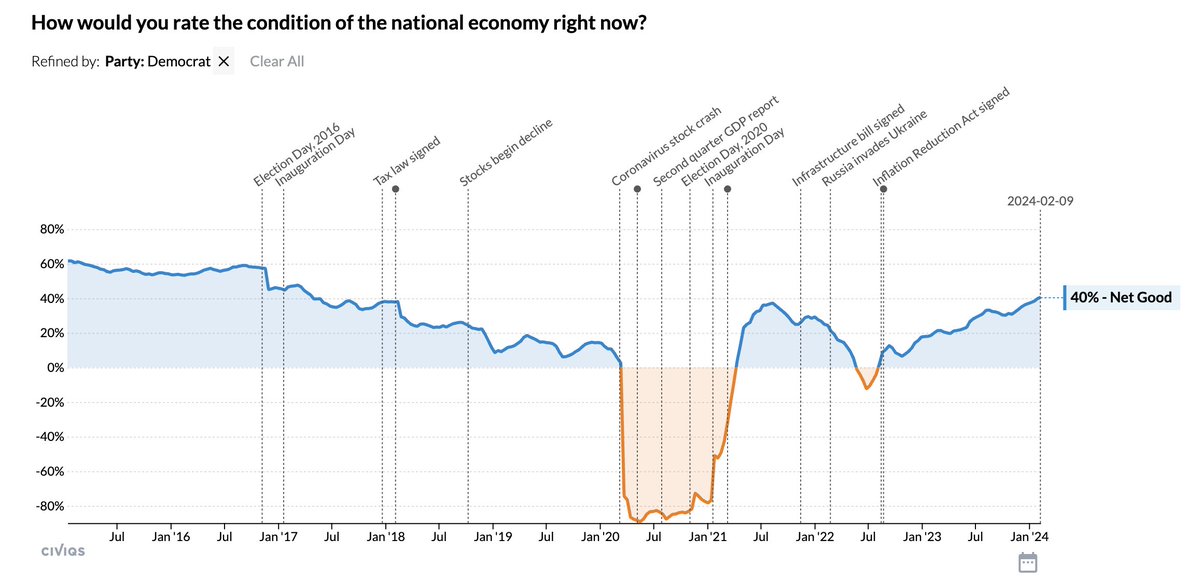
Now, real people don't read GDP reports. The public will on average come into the election with a sense that things have improved from the bottom but are still pretty bad — which is about right. 6/
This is, I think, bad news for Trump. The economy won't be bad enough to noticeably hurt him, unless that last job report is really bad; but it won't help him much either. And what else does he have? 7/
People believe (rightly) that he isn't even trying to save American lives, and his "scary antifa is coming for the suburbs" pitch doesn't seem to be working 8/
Imports are about 14 percent of US GDP. Federal income tax revenue (not including payroll taxes) is about 8 %. So you might think replacing it would require a tariff rate of 8/14 or around 57 percent. But ... 2/
Tariffs would raise the cost of imports to consumers, so we'd import less, which would mean you need a higher tariff rate. But this reduces imports further, meaning a still higher tariff, and so on 3/
The Fed survey of economic well-being is out; some changes at the margin, but the basic story remains that Americans say they're doing mostly OK, their local economy isn't too bad, but the national economy is terrible 1/
Consistent with polling. Here's Quinnipiac on Wisconsin voters 2/
With the recent rise in consumer sentiment, time to revisit this excellent Briefing Book paper. On reflection, I'd do it a bit differently; same basic conclusion, but I think partisan asymmetry explains even more of the remaining low numbers 1/ briefingbook.info/p/asymmetric-a…
The Michigan sentiment index has two components: current conditions and expectations. It's kind of legitimate to have partisan diffs on expectations, if you think your party has better policies. It's the gap on current conditions that's startling 2/
Michigan doesn't provide partisan breakdowns every month until 2017 (hence the limited range of that chart). A quick and dirty approach is to use annual averages, with whatever months they do provide for each year, which lets us push back to 2006 3/
Recent economic news has been extremely good. But there's a strange meme among some D consultants that Biden shouldn't boast about it, because it seems out of touch — that people aren't feeling the good economy. But they are! 1/
The venerable Michigan survey has rocketed up lately 2/
It's true that consumer sentiment is still weaker than you might expect given the economic numbers. But that's largely partisanship. Using Civiqs numbers, Democrats have more or less fully accepted the good news 3/
Immigration is looming larger in the campaign, partly because it's becoming harder for Republicans to run against Biden on the economy. But there's a strong case that immigration has been a key part of Biden's economic success 1/
Inflation has come down so easily in part because of strong labor force growth. How much of that growth can be attributed to foreign-born workers? All of it 2/
Some people might look at that and say that foreigners have stolen 3 million jobs from Americans. But we have full employment, indeed a very tight labor market. Look at what the Conference Board survey says 3/
A tale of two inflation measures. Some analysts are still citing the blue line, when they should be citing the red line. This is professional malpractice 1/
Using annual core CPI puts you way behind the curve, for 2 reasons. First, annual: even core CPI was 4.6 in the first half of 2023, 3.2 in the second half. Second, known lags in official shelter prices lagging far behind market rents 2/
So annual CPI creates a spurious impression of stubborn inflation, with a difficult last mile to cover. PCE puts a lower weight on shelter, and on a shorter-term basis tells us that we've already traveled that last mile 3/