Great question by @michaelxpettis & this happens occasionally with China data (industrial profit is one example).
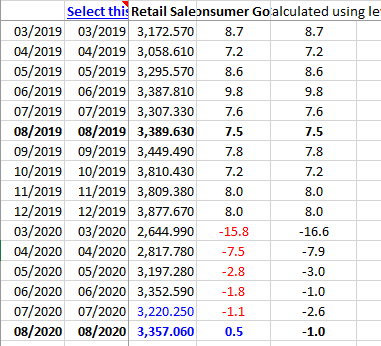
Why is it that when you take the level & calculate the %YoY, you get a diff #? This case, China retail sales -1% vs the +0.5%???
Why is it that when you take the level & calculate the %YoY, you get a diff #? This case, China retail sales -1% vs the +0.5%???
https://twitter.com/michaelxpettis/status/1306497330934243331
Here is the chart of the %YoY given by NBS for retail sales in blue & the orange line showing what you would get if you calculate from the level they say.
What do you see? A lot of smoothing of data.
What do you see? A lot of smoothing of data.
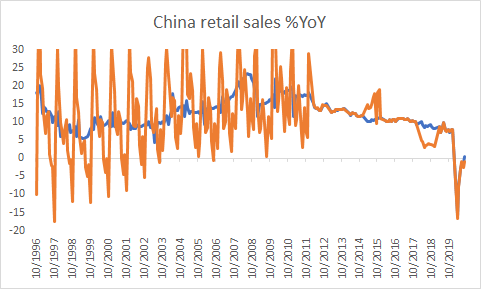
This data is nominal & not real but I think there must be some sort of revision/smoothing. Trends are the same, and that is that is a gradual improvement, although clearly a discrepancy b/n +0.5%YoY & -1%YoY. This isn't the only data set that has this issue. Industrial profit too
This is China industrial profit using %YoY from NBS (black line) & using the level that NBS publishes to calculate %YoY.
What do you see? They follow the same trend but clearly a discrepancy in profitability.
Why is that the case?
What do you see? They follow the same trend but clearly a discrepancy in profitability.
Why is that the case?
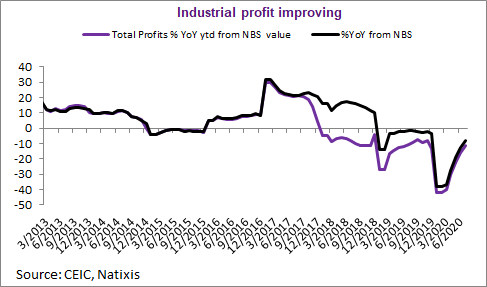
For industrial profit, the explanation that has been given is that NBS basically looks at the change of industrial profit relative to the firms that continue to exist (firms existed in 2019 but went out of biz they u take them out).
Anyway, just one of this things that happens.
Anyway, just one of this things that happens.

• • •
Missing some Tweet in this thread? You can try to
force a refresh