
September 17, 2020 - Canada/Ontario/Québec daily update
Current data as of 7 am.
Data is 100% public and official, and fully sourced.
#COVID19Ontario #covid19canada #covid19quebec
Current data as of 7 am.
Data is 100% public and official, and fully sourced.
#COVID19Ontario #covid19canada #covid19quebec


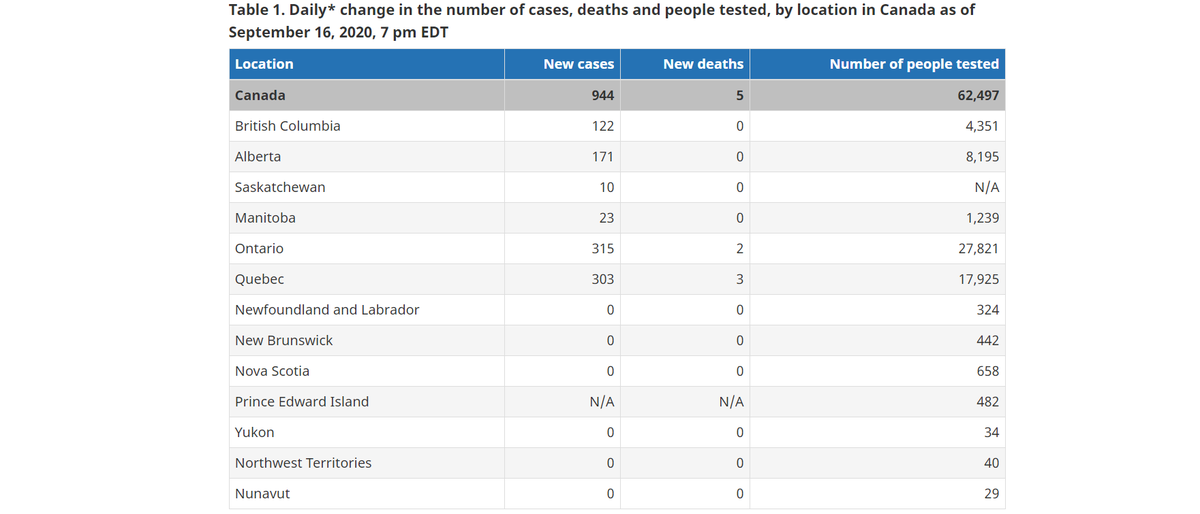
5 deaths reported in all of Canada (population: 37,971,020).
62,497 additional tests to confirm 944 additional cases (1.5%).
2.1 active cases per 10,000 people in Canada.
62,497 additional tests to confirm 944 additional cases (1.5%).
2.1 active cases per 10,000 people in Canada.
Canada - Covid-19 still presents a risk primarily to the elderly, not to children and hardly to working-age adults.
(n.b. Based on 2020 YTD data for Covid-19 - figures to be revised upward as needed.)
(n.b. Based on 2020 YTD data for Covid-19 - figures to be revised upward as needed.)
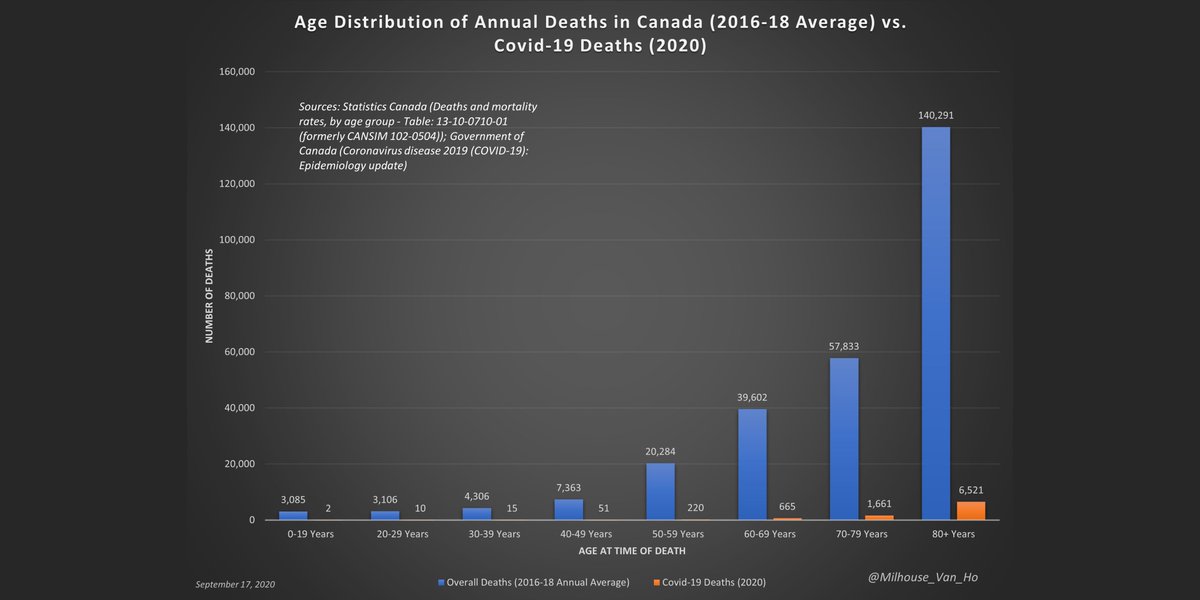
Deaths among those over 80 account for 71.3% of covid deaths.
This contrasts to overall deaths, for which the 80+ cohort accounts for 50.9% of deaths (based on 2016-2018 averages).
(n.b. Based on 2020 YTD data for Covid-19 - figures to be revised upward as needed.)
This contrasts to overall deaths, for which the 80+ cohort accounts for 50.9% of deaths (based on 2016-2018 averages).
(n.b. Based on 2020 YTD data for Covid-19 - figures to be revised upward as needed.)

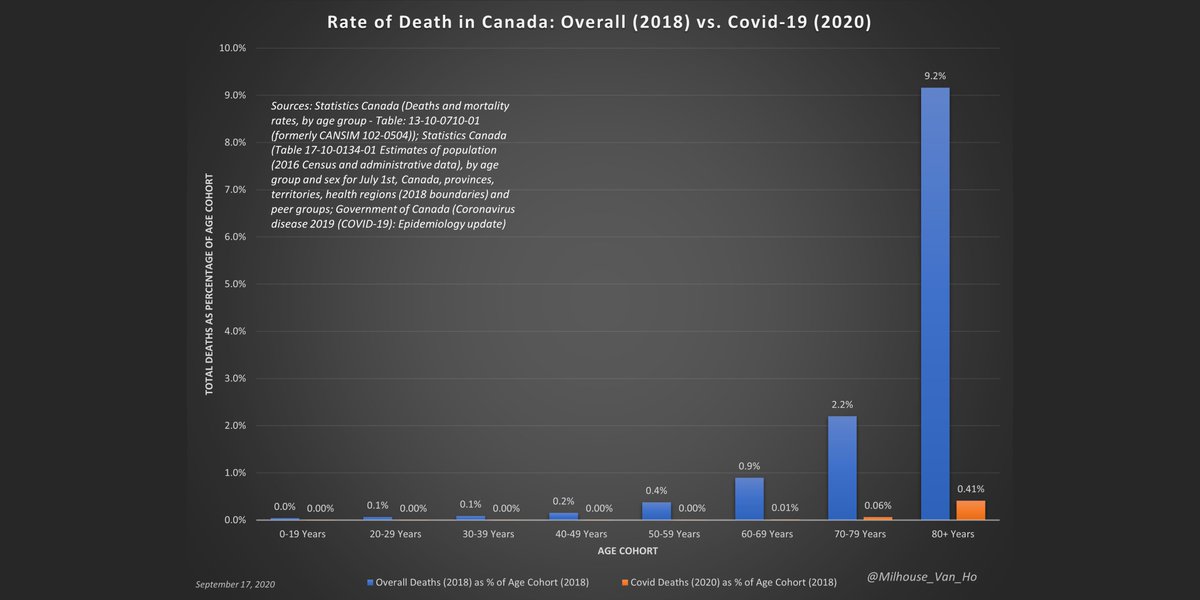
Bear in mind that the risk of death will always rise in line with one's advancing age.
In a given year, like 2018 as an example, 9.2% of those in the over-80 age cohort pass away.
(n.b. Based on 2020 YTD data for Covid-19 - figures to be revised upward as needed.)
In a given year, like 2018 as an example, 9.2% of those in the over-80 age cohort pass away.
(n.b. Based on 2020 YTD data for Covid-19 - figures to be revised upward as needed.)
Children and young adults are at lower risk from Covid-19 than from influenza and pneumonia.
The risk of death by Covid-19 is higher than that by influenza and pneumonia as one's age advances.
(n.b. Based on 2020 YTD data for Covid-19 - figures to be revised upward as needed.)
The risk of death by Covid-19 is higher than that by influenza and pneumonia as one's age advances.
(n.b. Based on 2020 YTD data for Covid-19 - figures to be revised upward as needed.)

If considered as a wholly distinct and separate cause of death in Canada, Covid-19 may be the 6th leading cause of death in 2020, much like influenza and pneumonia.
(n.b. Based on 2020 YTD data for Covid-19 - figures to be revised upward as needed.)
(n.b. Based on 2020 YTD data for Covid-19 - figures to be revised upward as needed.)
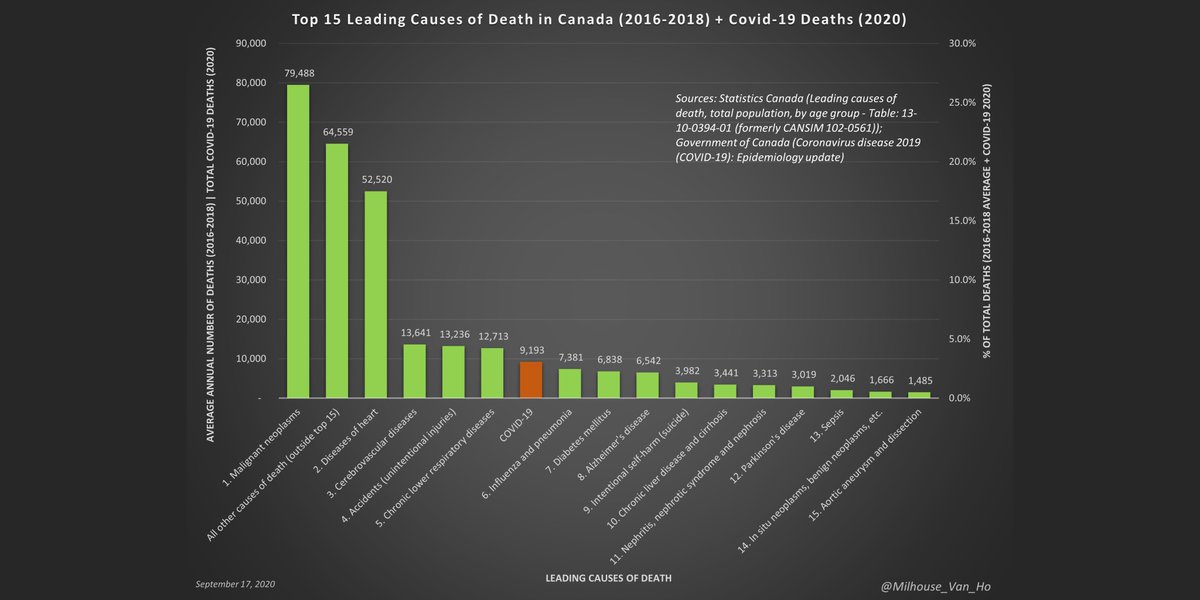
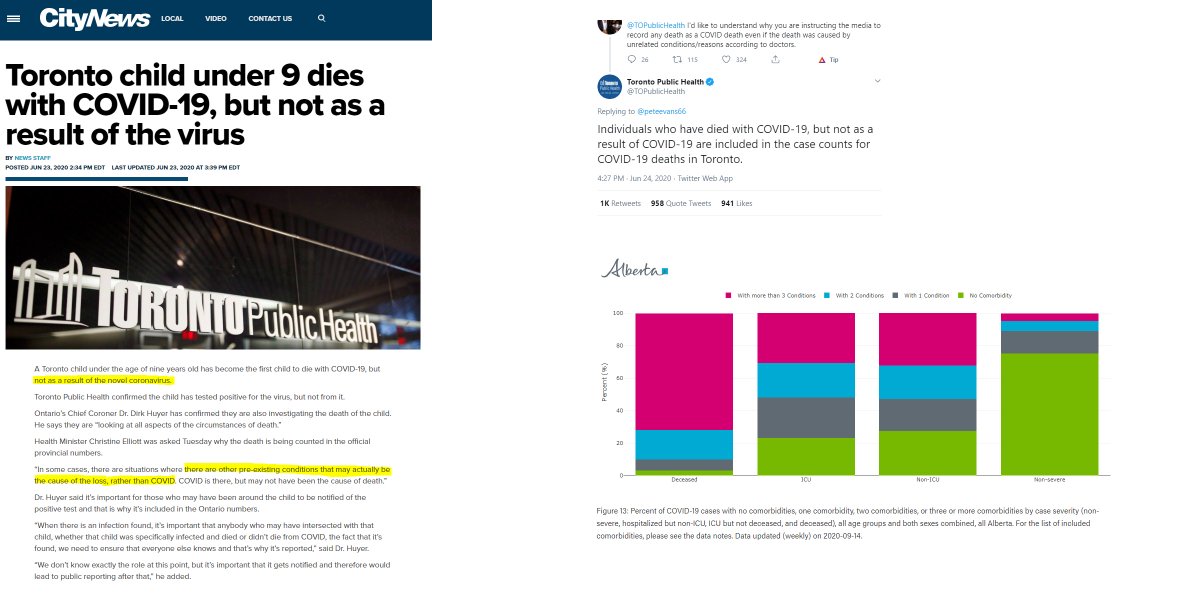
However, Covid-19 is often not a wholly distinct and separate cause of death as there are other medical conditions involved in many cases.
There are also cases in which it is not even a cause of death, but the individual had tested positive sometime prior to their death.
There are also cases in which it is not even a cause of death, but the individual had tested positive sometime prior to their death.
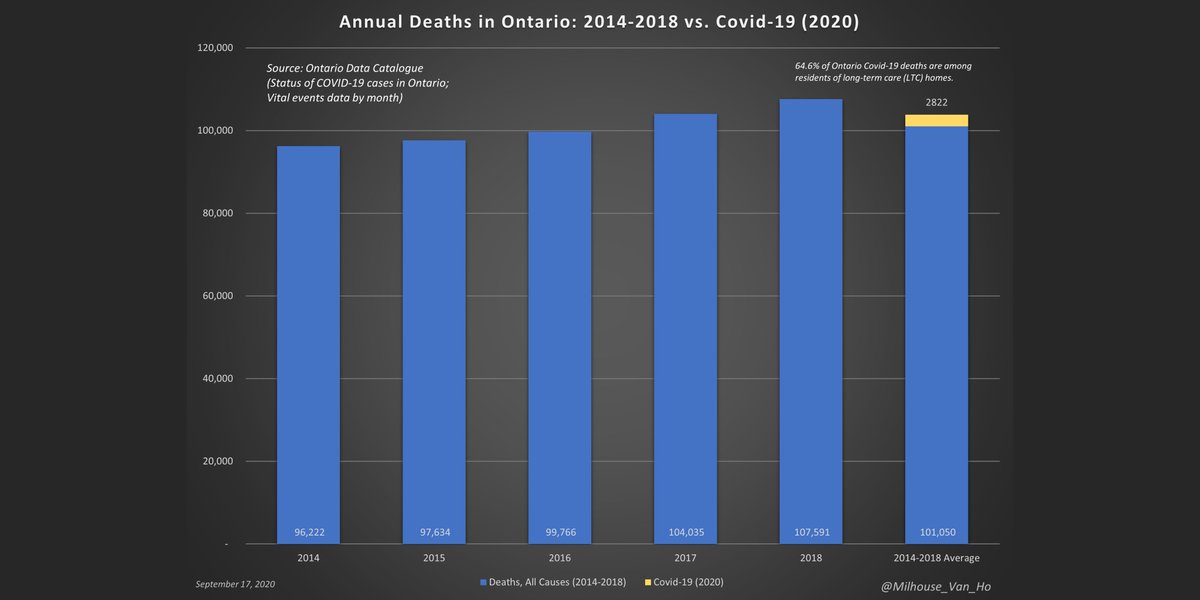
This is what 2020 might look like in Ontario year-to-year if:
1. All-cause deaths (excl. Covid-19) are in line with 2014-18 averages
2. All Covid-19 deaths are single-cause excess deaths
(n.b. Based on 2020 YTD data for Covid-19 - figures to be revised upward as needed.)
1. All-cause deaths (excl. Covid-19) are in line with 2014-18 averages
2. All Covid-19 deaths are single-cause excess deaths
(n.b. Based on 2020 YTD data for Covid-19 - figures to be revised upward as needed.)
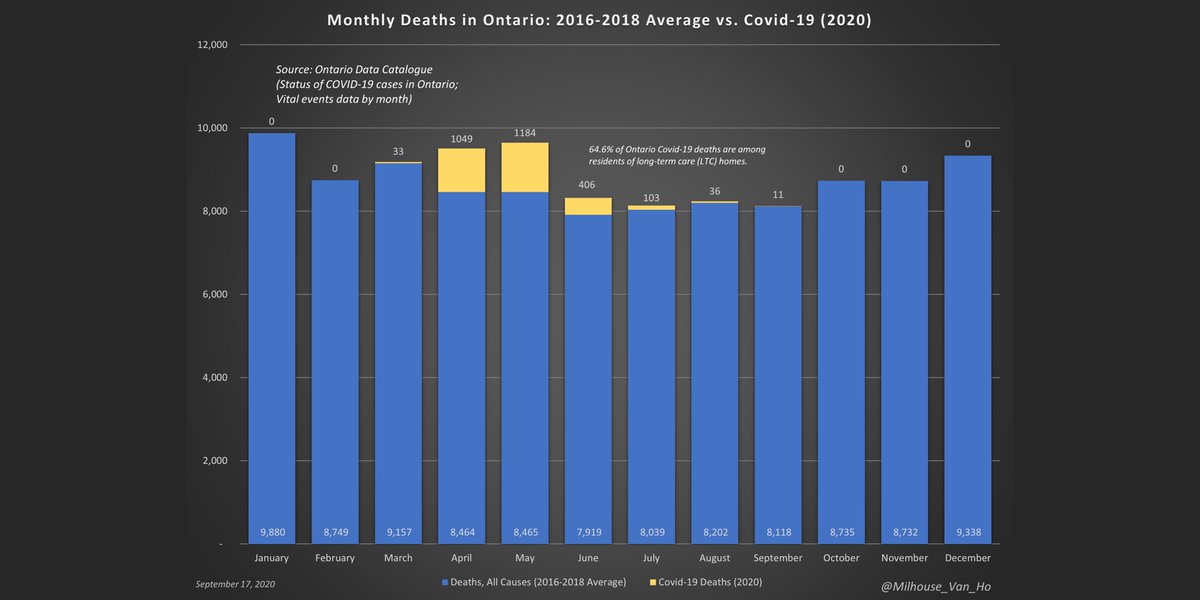
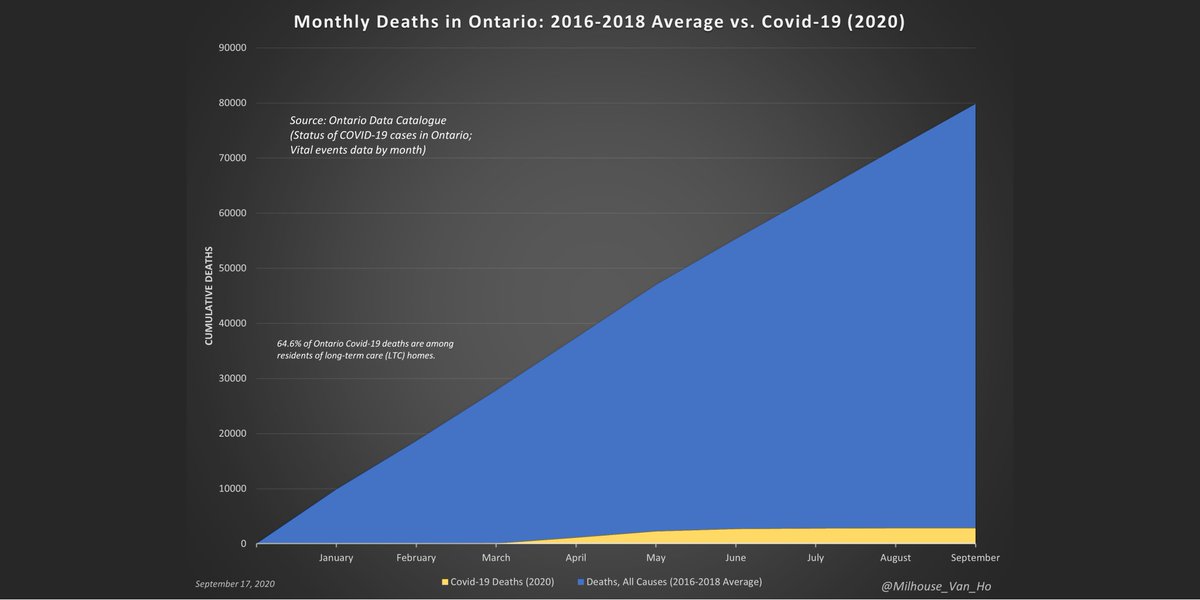
This is what 2020 might look like in Ontario month-to-month if:
1. All-cause deaths (excl. Covid-19) are in line with 2016-18 averages
2. All Covid-19 deaths are single-cause excess deaths
(n.b. Based on 2020 YTD data for Covid-19 - figures to be revised upward as needed.)
1. All-cause deaths (excl. Covid-19) are in line with 2016-18 averages
2. All Covid-19 deaths are single-cause excess deaths
(n.b. Based on 2020 YTD data for Covid-19 - figures to be revised upward as needed.)
Ontario has reported 11 covid deaths so far in September.
- That's an average of 0.7 deaths / day.
Ontario now reports:
- 1.6 active cases per 10,000 people
- That's an average of 0.7 deaths / day.
Ontario now reports:
- 1.6 active cases per 10,000 people
Ontario now reports:
- 1.6 active cases per 10,000 people
- 20 in ICU (+1)
- 12 in ICU on a ventilator (+1)
- 1.6 active cases per 10,000 people
- 20 in ICU (+1)
- 12 in ICU on a ventilator (+1)

Ontario now reports:
- 1.6 active cases per 10,000 people
- 44 in hospital (-3)
- 20 in ICU (+1)
- 12 in ICU on a ventilator (+1)
- 1.6 active cases per 10,000 people
- 44 in hospital (-3)
- 20 in ICU (+1)
- 12 in ICU on a ventilator (+1)

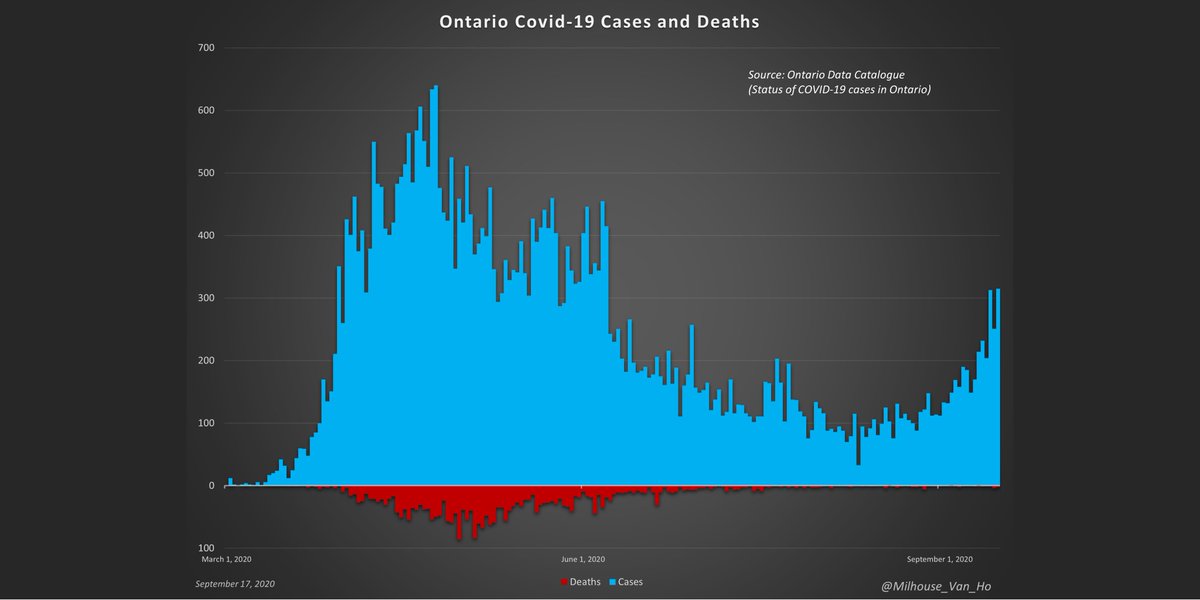
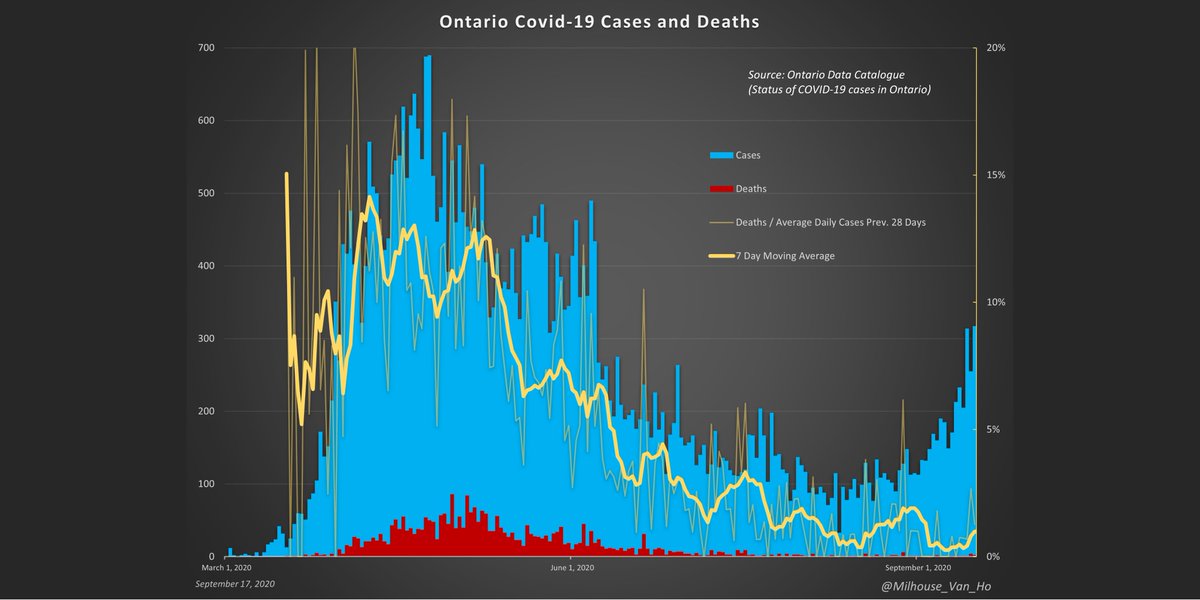
Ontario - The proportion of cases resulting in death (yellow line) has fallen from ~15% at peak.
In September, the proportion of average daily deaths to average daily cases in the preceding 28 days is 0.6%.
In September, the proportion of average daily deaths to average daily cases in the preceding 28 days is 0.6%.
This is what 2020 YTD might look like in Ontario on a cumulative basis, using 2016-18 average monthly deaths as a proxy for 2020 data.
Ontario - Growth in cumulative cases is outpacing growth in cumulative deaths.
September so far:
- 279 cases per 1 death (0.35%)
- Cumulative cases up 7.3%
- Cumulative deaths up 0.4%
September so far:
- 279 cases per 1 death (0.35%)
- Cumulative cases up 7.3%
- Cumulative deaths up 0.4%

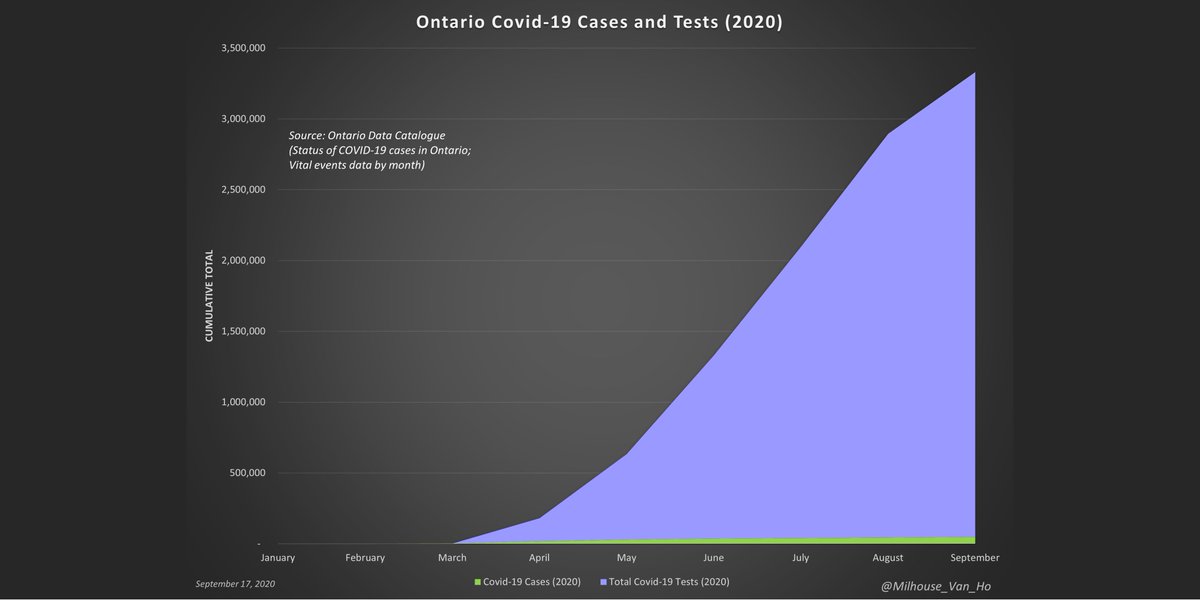
Ontario - Growth in cumulative tests conducted is outpacing growth in cumulative cases.
September so far:
- 141 tests conducted per 1 positive test (0.7%)
- Cumulative tests up 15.1%
- Cumulative cases up 7.3%
September so far:
- 141 tests conducted per 1 positive test (0.7%)
- Cumulative tests up 15.1%
- Cumulative cases up 7.3%
The Ontario government's ramping up of testing has been a major contributing factor to the growth in cases. Cases will probably rise further as the government works toward its goal of 50,000 tests per day.

Québec has reported 18 covid deaths so far in September (to April 15th).
- That's an average of 1.2 deaths / day.
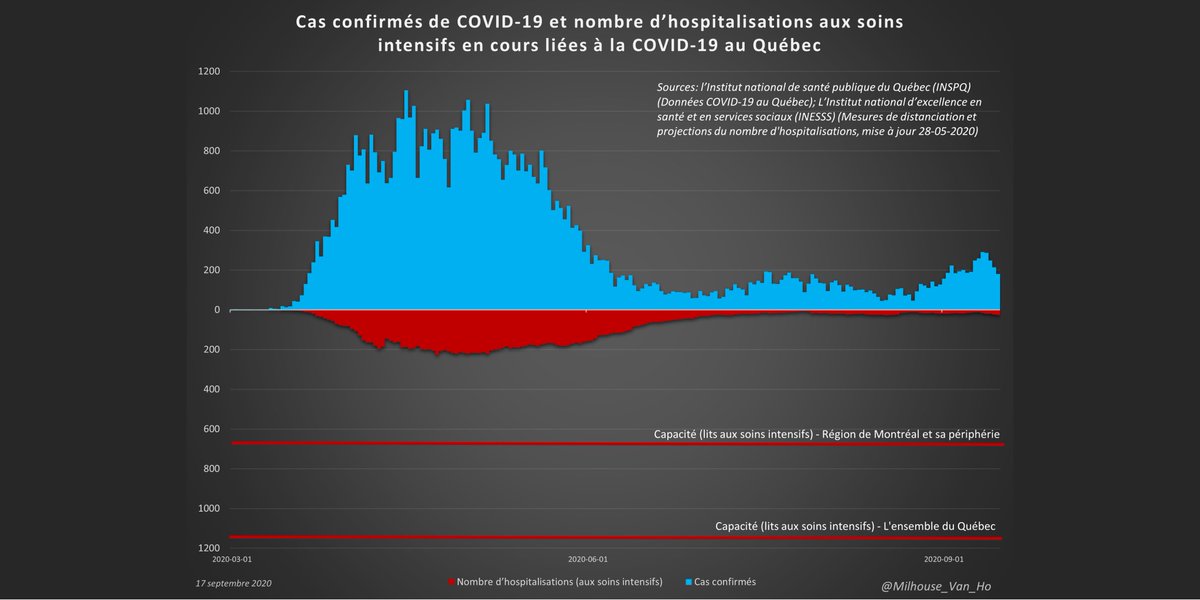
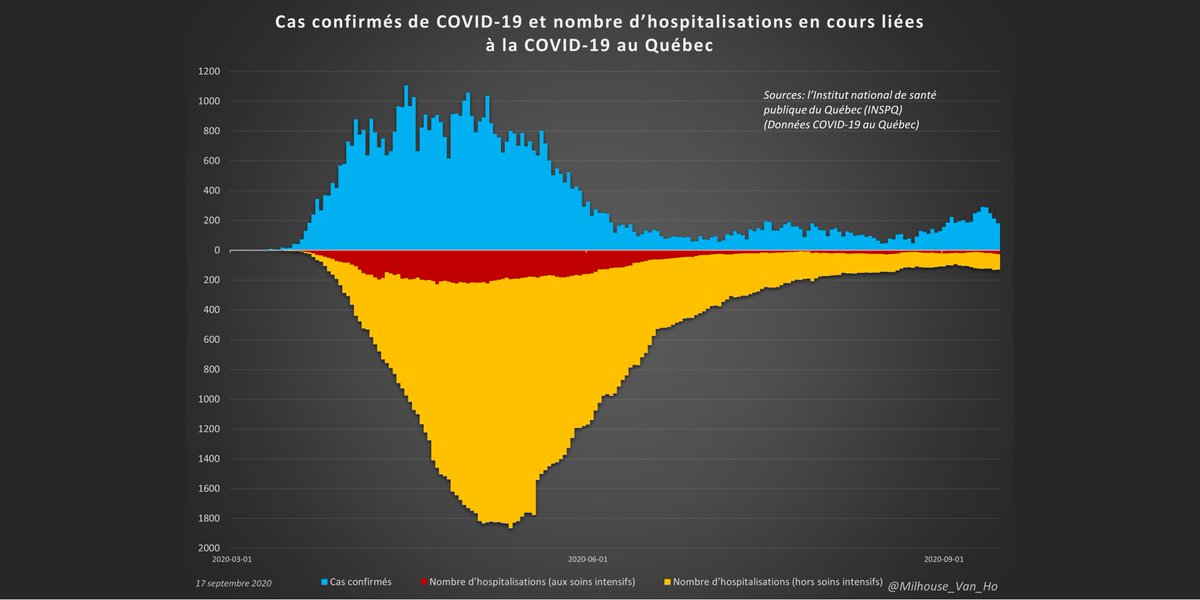
Québec now reports:
- 2.7 active cases per 10,000 people
- That's an average of 1.2 deaths / day.
Québec now reports:
- 2.7 active cases per 10,000 people

Québec now reports:
- 2.7 active cases per 10,000 people
- 26 in ICU (+3)
- 2.7 active cases per 10,000 people
- 26 in ICU (+3)
Québec now reports:
- 2.7 active cases per 10,000 people
- 130 in hospital (-3)
- 26 in ICU (+3)
- 2.7 active cases per 10,000 people
- 130 in hospital (-3)
- 26 in ICU (+3)
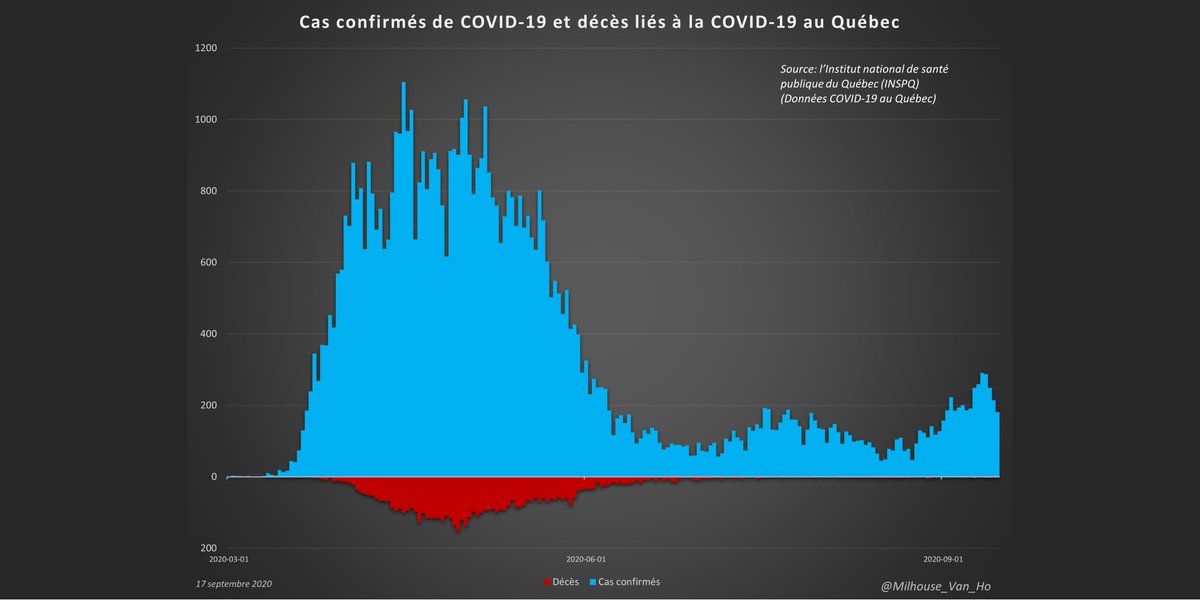
Québec - The proportion of cases resulting in death (yellow line) has fallen from ~15% at peak.
In September, the proportion of average daily deaths to average daily cases in the preceding 28 days is 0.9%.
In September, the proportion of average daily deaths to average daily cases in the preceding 28 days is 0.9%.

@fordnation @JohnTory @JustinTrudeau @CPHO_Canada @ACSP_Canada @epdevilla @celliottability @UHN @francoislegault
• • •
Missing some Tweet in this thread? You can try to
force a refresh


