

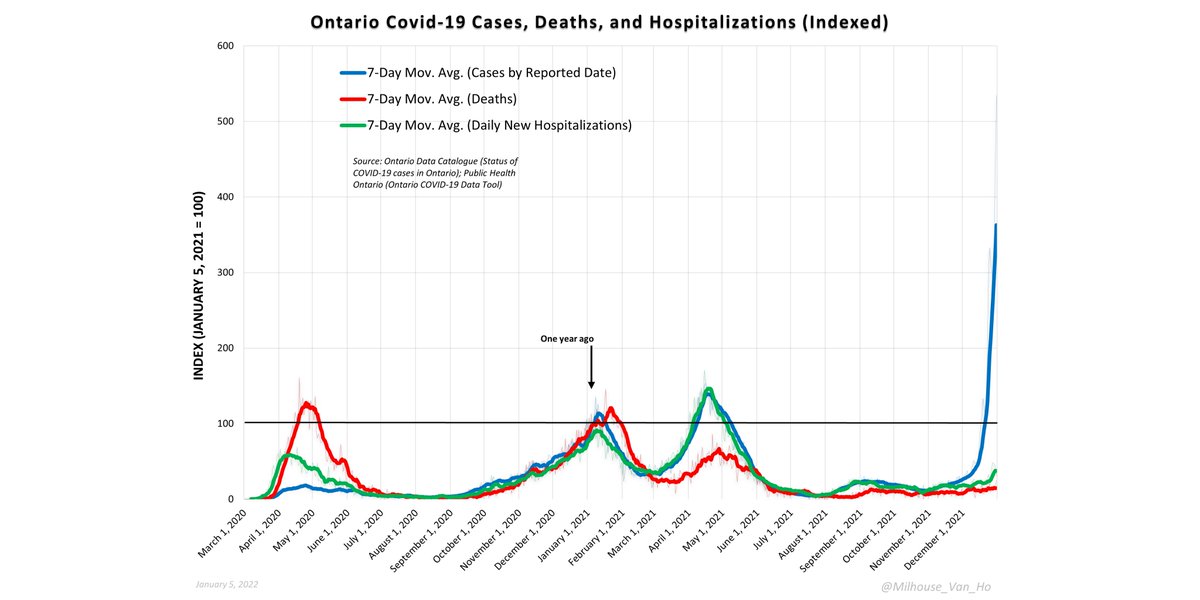
 2. Cases, hosp'zns & deaths indexed to values 1 year earlier. Black line (index=100) is 365 days ago (all values indexed to values on that date).
 Canada total weekly deaths 2016 to 2021.
 The wording of the Instagram post is available here for those who can read Japanese or who want to attempt a translation.
 2. Cases, hosp'zns & deaths indexed to values 1 year earlier. Black line (index=100) is 365 days ago (all values indexed to values on that date).
 2. Weekly all-cause deaths and deaths with/from Covid-19 in Ontario, 2010-2022 (subject to Statistics Canada reporting delay for all-cause deaths).
 2. Weekly all-cause deaths and deaths with/from Covid-19 in Ontario, 2010-2021 (subject to Statistics Canada reporting delay for all-cause deaths).
 2. Weekly all-cause deaths and deaths with/from Covid-19 in Ontario, 2010-2021 (subject to Statistics Canada reporting delay for all-cause deaths).
 2. Weekly all-cause deaths and deaths with/from Covid-19 in Ontario, 2010-2021 (subject to Statistics Canada reporting delay for all-cause deaths).
 2. Comparaison saisonnière 2020/2021: Nouvelles hospitalisations (hors soins intensifs) liées à la Covid-19 (Québec).
 Canada total weekly deaths January 2010-September 2021.
 2. 2020/2021 seasonal comparison: The number of hospitalizations from/with covid-19 in Ontario.
 2. Weekly all-cause deaths and deaths with/from Covid-19 in Ontario, 2010-2021 (subject to Statistics Canada reporting delay for all-cause deaths).
 2. Cases, hosp'zns & deaths indexed to values 1 year earlier. Black line (index=100) is 365 days ago (all values indexed to values on that date).
 2. Cases, hosp'zns & deaths indexed to values 1 year earlier. Black line (index=100) is 365 days ago (all values indexed to values on that date).
 First, it might mean not only are we losing the war now, we will lose in the end too. Humanity has little chance of "defeating" a seasonal respiratory virus.
 2. Cases, hosp'zns & deaths indexed to values 1 year earlier. Black line (index=100) is 365 days ago (all values indexed to values on that date).
 2. 2020/2021 seasonal comparison: The number of deaths from/with covid-19 in Ontario.
 New Hospitalizations Linked to Covid-19 / Nouvelles hospitalisations liées à la Covid-19 (Ontario/Québec)
 2. 2020/2021 seasonal comparison: The number of deaths from/with covid-19 in Ontario.