Kyle Lamb Profile picture
Sep 18, 2020 15 tweets 5 min read Read on X
Today the CDC acknowledged what has been known for several weeks: the flu has largely disappeared this flu season in the southern hemisphere. The CDC is spinning this as being the result of mitigation (masks, lockdowns, etc.). This thread will show that to be false.

-1-
First off, WHO has NEVER found lockdowns/mitigation to stop the flu. Here is their guidance from 2019 saying isolation/quarantine simply doesn't work

-2-
Let's be more blunt, a working group by WHO found in 2006 that there has never been any evidence of quarantine/isolation strategies stopping the spread of the flu

-3-
So what's the deal? I believe it's the virus itself that's impeding the flu. But to show that, I need to eliminate mitigation as a factor. More on that on a moment. But I have been calling this: they're banking on a light flu season to take credit.


-4-
The flu has been seen at historically low levels in the Southern hemisphere. Under 2% positive rate, in fact. Most years, WHO reports southern temperate regions to be between 10-30%. Not a single one has been at 10% this year.

-5-
So if it's not mitigation, why did the flu disappear then. As I said, I think it's the virus itself causing it to disappear. To illustrate this, let's use a normal flu season here in the U.S.

-6-
First, here are the last three years for confirmed Flu hospitalizations in the U.S. for calendar weeks 1-17. These are on a per 100,000 basis. You can see a steady, reliable downward trend in the yellow weeks 10-17.

-7-
Now let's look at Flu surveillance for cases and tests in U.S. clinical labs by the same weeks for the same three years. The highlighted columns are percent positive tests. Again, we see positive testing fall slowly and consistently.

-8-
Now that we have established our baseline for flu trends, let's go back to hospitalizations and add in this flu season (2019-20). Strangely (or not), flu hospitalizations fell off a cliff starting after week 10 (week ending March 7).

-9-
You might ask, well is it because of lockdowns? They didn't start until weeks 12-14 in most areas and wouldn't have changed the numbers that quickly. Was it no more flu testing? No. See what happens to the percent positive testing in the same timeframe.

-10-
Almost by magic, while testing did not really decrease much until at the very end, the percent of tests that were positive just completely vanished. Gone. Flu was nowhere to be found.

-11-
To me, since flu disappeared here in the U.S. when Covid-19 arrived AND disappeared in the southern hemisphere where Covid was already lurking when flu season began, this demonstrates circulation of Covid-19 is causing disruption in flu spread; NOT mitigation causing this.

-end-
Addendum #1: Folks are still trying to argue lockdowns helped and this is a terrible argument. I have receipts.

Only 3 stay at home orders took effect at the very end of MMWR 12 (March 21); AK, CA & CO. Rest were 13/14

Lab results are when REPORTED to CDC (not collection)
So most results reported week 13 were likely from week 12 or possibly before. It would take an additional few weeks for mitigation to have any impact. At minimum, if lockdowns had ANY impact it wouldn't show until ~14 or 15. By then, its' very clear from the data flu was done.
Let's spell this out so there isn't confusion:

Literally, the nosedive cannot be reasonably explained by mitigation. We know masks were not a factor and the timeline here explains why lockdowns didn't do it.

• • •

Missing some Tweet in this thread? You can try to force a refresh
 

Keep Current with Kyle Lamb

Kyle Lamb Profile picture

Stay in touch and get notified when new unrolls are available from this author!

Read all threads

This Thread may be Removed Anytime!

PDF

Twitter may remove this content at anytime! Save it as PDF for later use!

Try unrolling a thread yourself!

how to unroll video
  1. Follow @ThreadReaderApp to mention us!

  2. From a Twitter thread mention us with a keyword "unroll"
@threadreaderapp unroll

Practice here first or read more on our help page!

More from @kylamb8

Nov 1, 2023
Does the NCAA permit Michigan to use a "scouting service" to scout future opponents? Yes...but also no.

Michigan fans are clinging to a 2013 bylaw change as hope they will be spared the wrath of the NCAA. Michigan's own actions suggest they don't believe this.

A thread.
The rule banning in-person scouting of future in-season opponents came in 1994. In the wake of rising athletics revenues from media rights, the difference in budgets was stark. NCAA wanted to keep schools with smaller revenue from being at a disadvantage...

2/
To help accomplish this, the NCAA banned in-person scouting outright except for postseason tournaments of a few sports. This kept bigger schools from paying large expenses to send multiple scouts to various contests.

Below is the rule, bylaw 11.6.2, as of 2012...

3/ Image
Read 18 tweets
Mar 14, 2023
Moody's:

"Moody’s credit analysis seeks to incorporate all issues that can materially impact credit quality, including ESG and climate risk; and aims to take the most forward-looking perspective that visibility into these risks and mitigants permits."

esg.moodys.io/esg-credit
Since 2019, Moody's has been incorporating ESG/DEI into its credit ratings of businesses.

"The methodology was updated to explain further our integration of ESG in credit analysis, in particular through our ESG scores."

2/3
"The credit impact of ESG considerations is highly negative or very highly negative for about 20% of the more than 5,700 debt issuers that we have scored for exposure to ESG risks."

That's 1-in-every-5 Moody's dings for not abiding by ESG, rather than fiscal responsibility.

3/4
Read 4 tweets
Feb 22, 2023
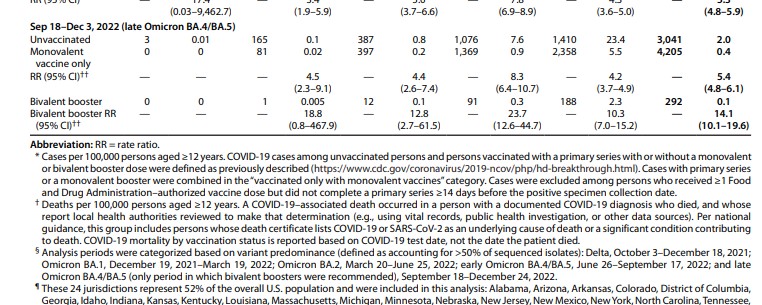
CDC is out here throwing data from several "multijurisdictional reports" of case rates together, despite a mountain of limitations, and presenting it as science.

These people are just doubling down on junk data. This is not at all intuitive.
These jurisdictional reports do not account for previous infection, length of time between shots or other confounding variables. Worse yet, some vaccination data has proven to be incomplete and literally includes unknown status as unvaccinated. These need to be controlled for.
Folks this is INFURIATING.

When you look at their actual data, late Omicron has 12-17 unvaccinated as three total deaths. This is the date range for the approved bivalent booster. Three.

I don't have to tell you that is not a statistically valid sample for a million reasons.
Read 5 tweets
Jan 30, 2023
Three important pieces posted this past week detailing the incentives to overcount deaths associated with COVID-19. The first published in @Newsweek by @DrJBhattacharya and I. Nearly 450,000 Americans have received funeral expense reimbursement.

A COVID diagnosis makes hospitals eligible for 20% addon payments by CMS for Medicare patients (simply testing + when admitted for any reason). Further, when having COVID on the death certificate, families are eligible for funeral expense reimbursement by FEMA.

2/
A column published on the same day in @WSJ by @MSmelkinsonPhD @LeslieBienen and @JeanneNoble18 delved further into the incentives to overcount.

3/

wsj.com/articles/the-v…
Read 17 tweets
Jan 30, 2023
Befuddling NFL officiating in last few minutes of this game:

* Int. grounding called on JB, but not on PM on 2nd & 4 throw that didn't get back to LOS

* Late hit called on PM, but not on JB throw

* Missed hold & block in back on punt

* Two missed holds on PM scramble
To me, I credit Mahomes for making plays, but this game was won by the KC d-line taking advantage of the Cincinnati injuries up front. But the one-sided officiating was shocking.
They sure had a selective memory of the rules regarding late hits:

Exhibit A

Read 4 tweets
Jan 11, 2023
As some still try to fearmonger on new variants, rise in cases, etc., we are reminded it's baseless.

Here is ave. inpatient census (with) COVID-19 by week (1st axis), w/ave ICU, multiple cause of death & underlying cause (2nd axis). Notice the separation since spring of 2022. Image
Blue = inpatient beds used for suspected/confirmed COVID

Orange = ICU census w/confirmed COVID

Gray = all deaths with COVID on death certificate

Yellow = all deaths where COVID was listed as primary (underlying) cause.

2/
Data sources: HHS Reported Inpatient Impact and Hospital Capacity timeseries used for hospital and ICU census where the daily average was used for corresponding weeks.

CDC Wonder MMWR weeks used for weeks ending for multiple and underlying cause of death

3/
Read 4 tweets

Did Thread Reader help you today?

Support us! We are indie developers!


This site is made by just two indie developers on a laptop doing marketing, support and development! Read more about the story.

Become a Premium Member ($3/month or $30/year) and get exclusive features!

Become Premium

Don't want to be a Premium member but still want to support us?

Make a small donation by buying us coffee ($5) or help with server cost ($10)

Donate via Paypal

Or Donate anonymously using crypto!

Ethereum

0xfe58350B80634f60Fa6Dc149a72b4DFbc17D341E copy

Bitcoin

3ATGMxNzCUFzxpMCHL5sWSt4DVtS8UqXpi copy

Thank you for your support!

Follow Us!

:(