datatosee.com Profile picture
Sep 19, 2020 11 tweets 4 min read Read on X
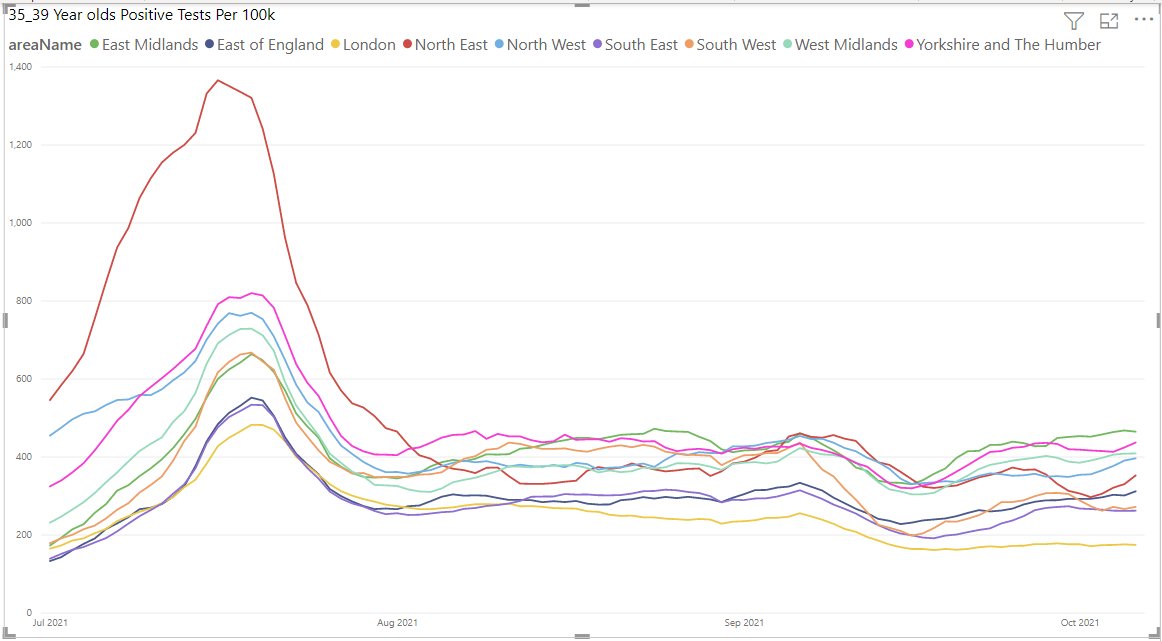
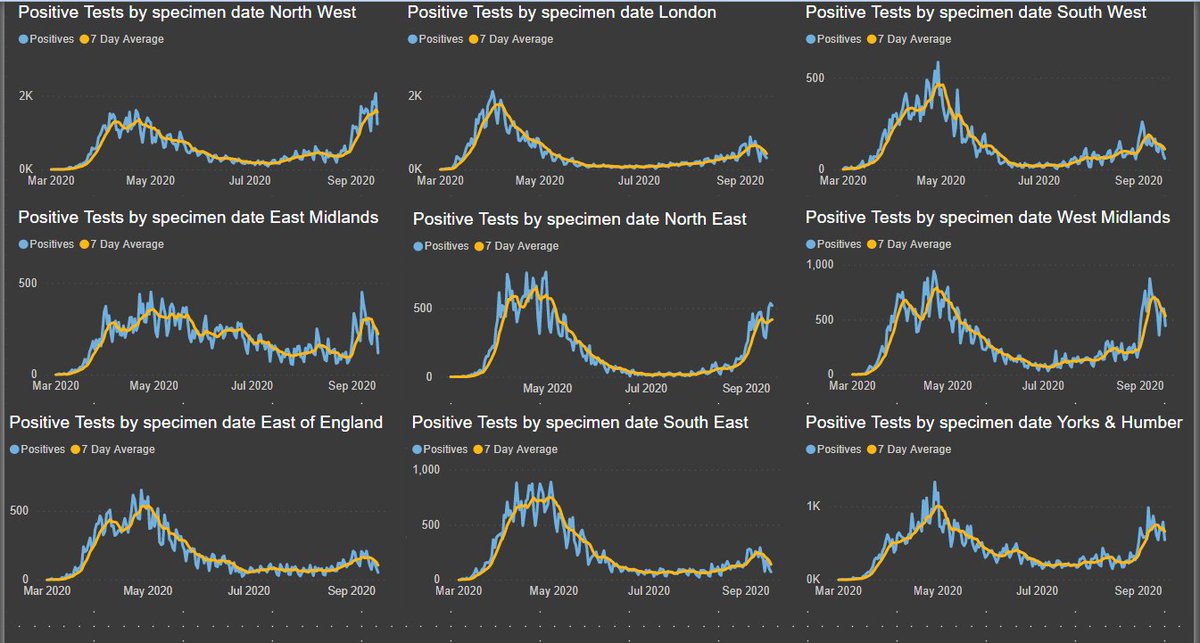
1/ Updated regional data for positive tests by SPECIMEN DATE, reported date is useless when there are backlogs in testing.

The data is to the 17th September, full size regional charts below. Forgot to set all scales the same will do next time!
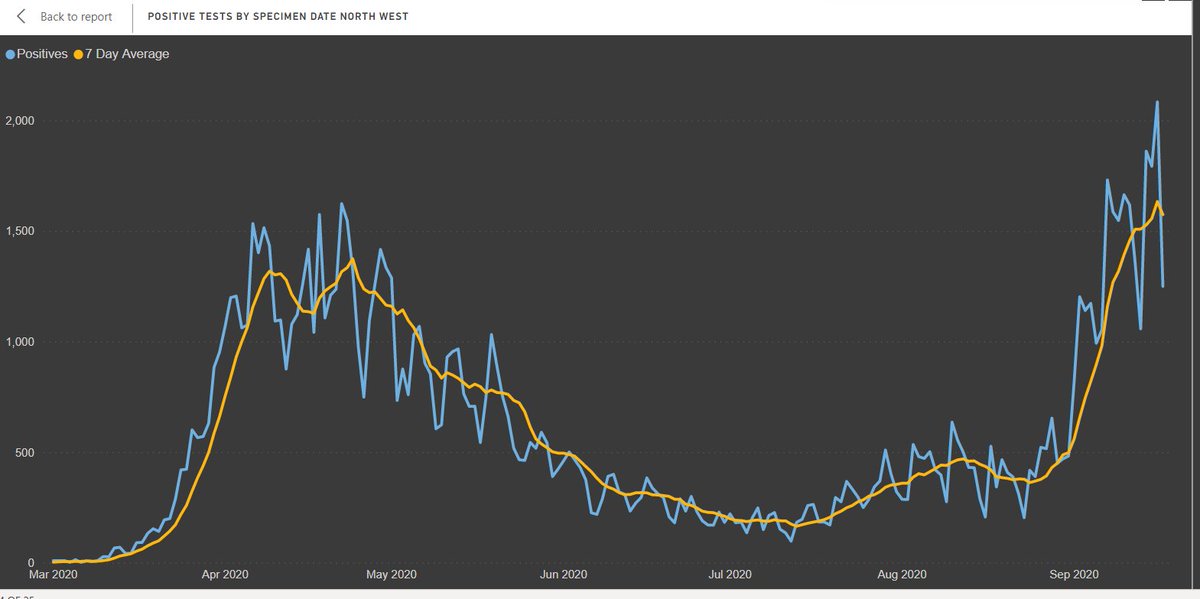
2/ North West

Think we will have to wait a few more days to see if this region is flattening off. The last few days of data for this is quite noisy.
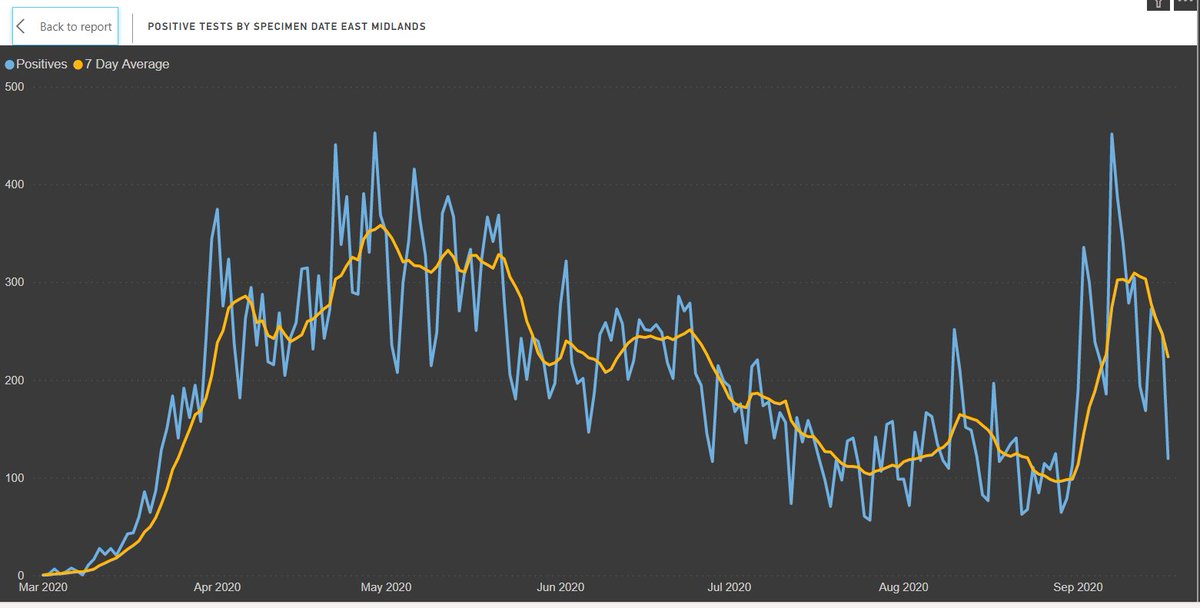
3/ East Midlands

This has a distinct downwards trend since the 11th
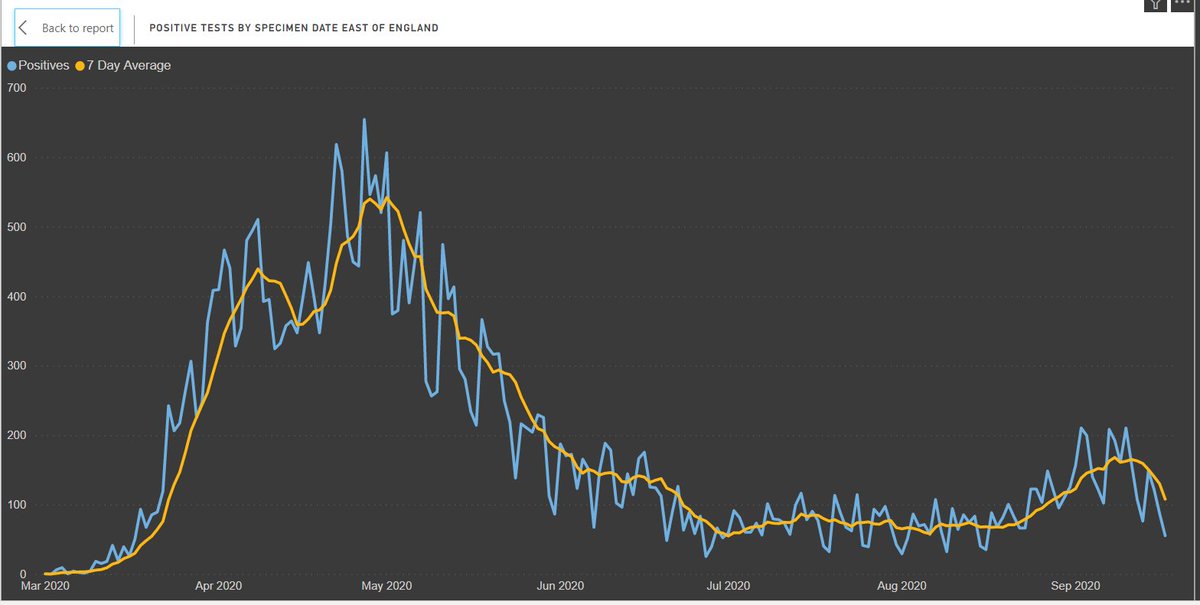
4/ East of England

Downward trends since the 12th, will backlog in tests being processed increase the days after, we will have to wait and see
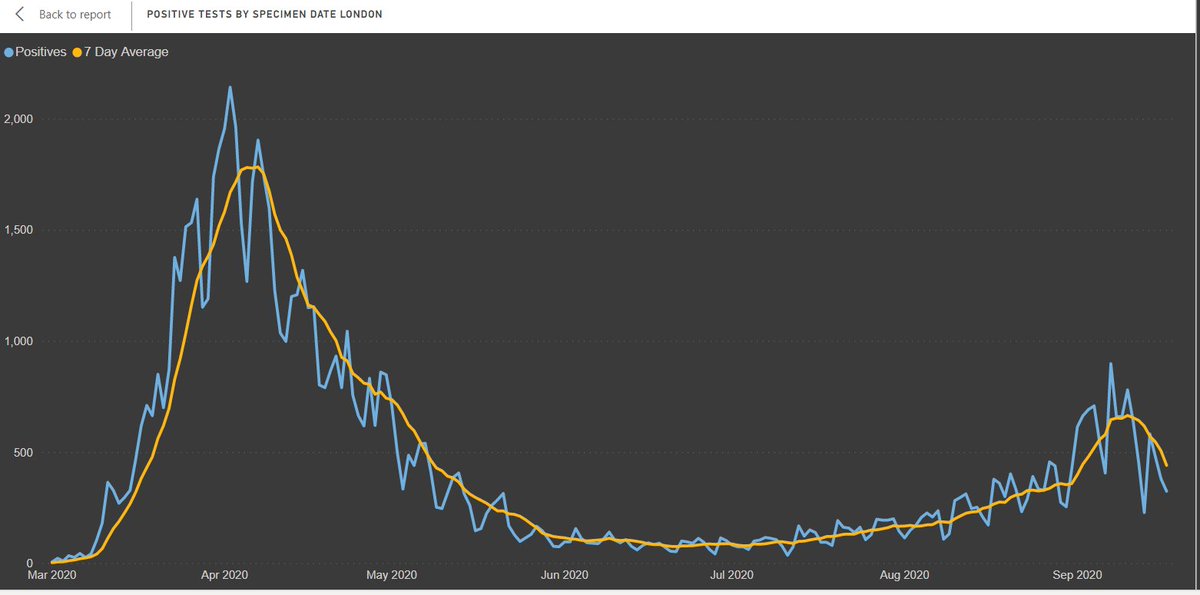
5/ London

Again decreasing trend since the 11/12th September
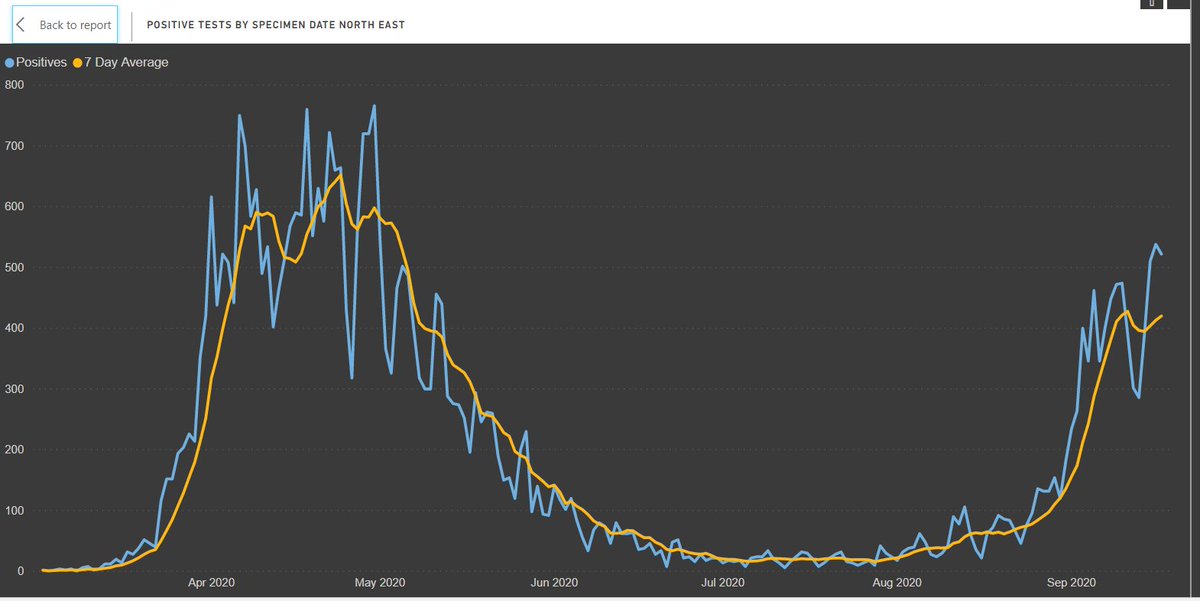
6/ North East

A flattening has happened from the 11th but really need to see over next few days for this for the days after the 11th
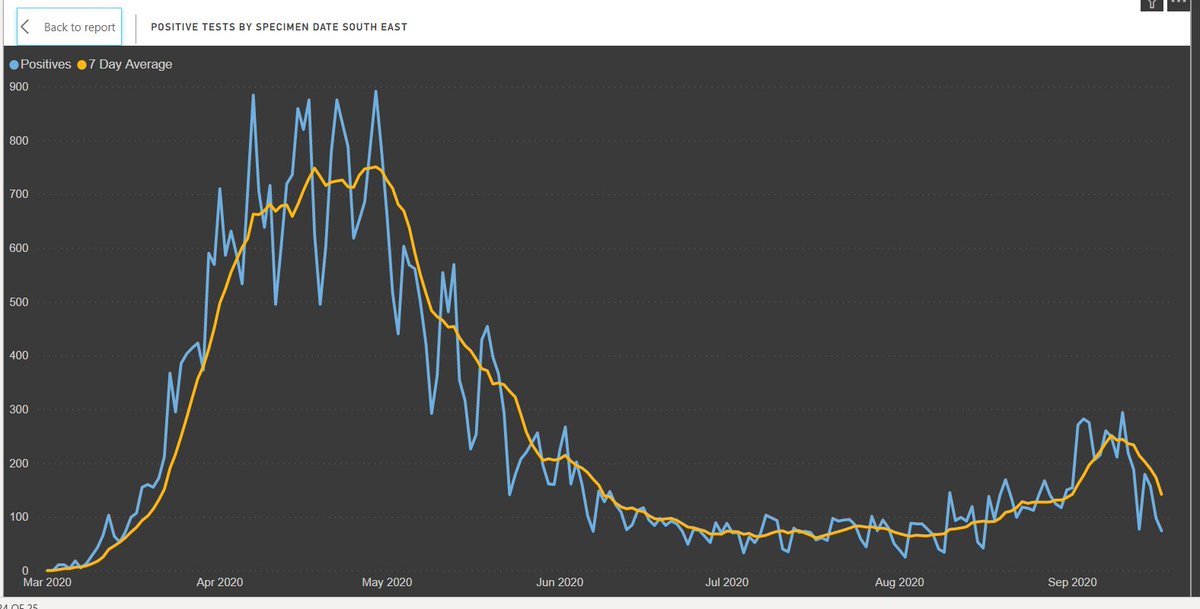
7/ South East

Only a small increase compared to other regions early September but now on downward trend.
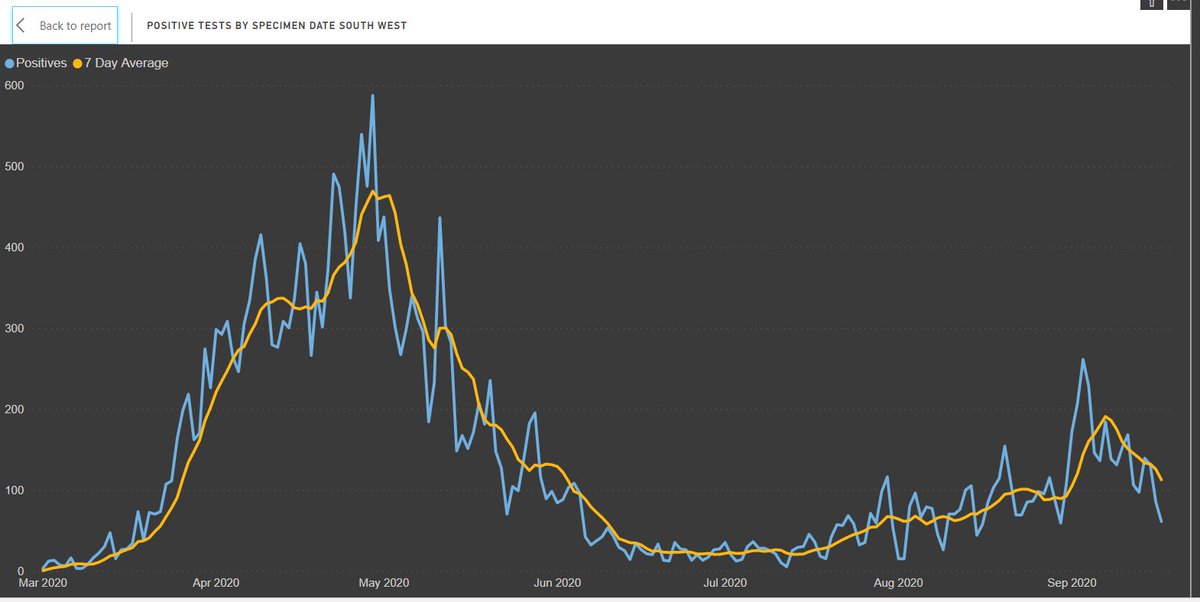
8/ South West

Been decreasing since the 8th September so would be safe there should be not be backlog going back this far.
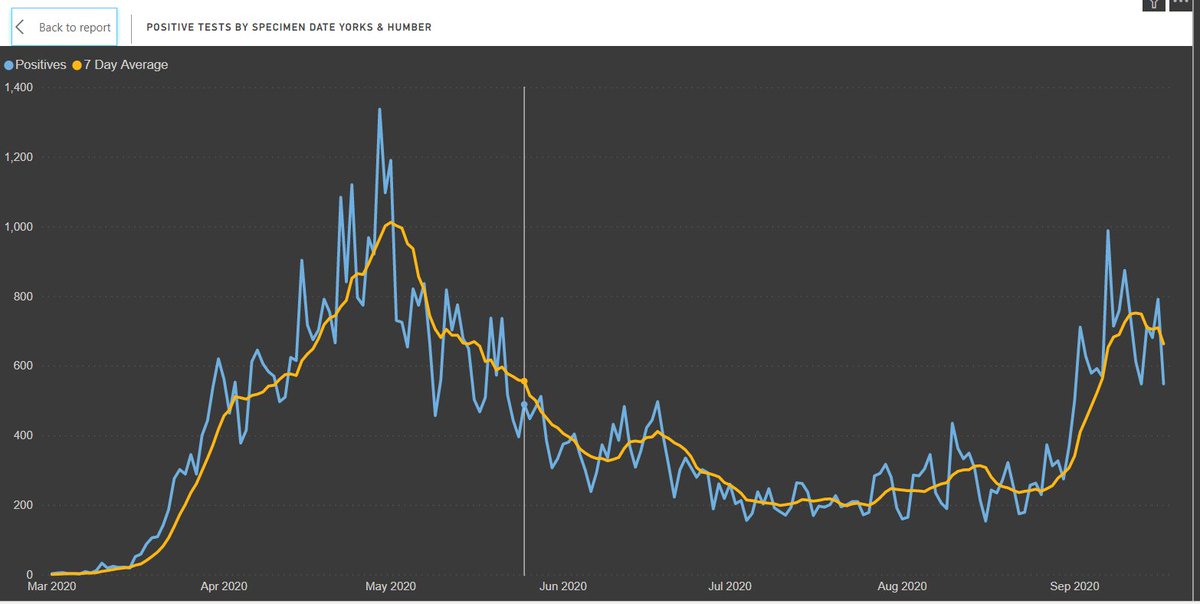
9/ Yorkshire & Humber

Peak at 12th really need to wait a few days to see what happens with this one.
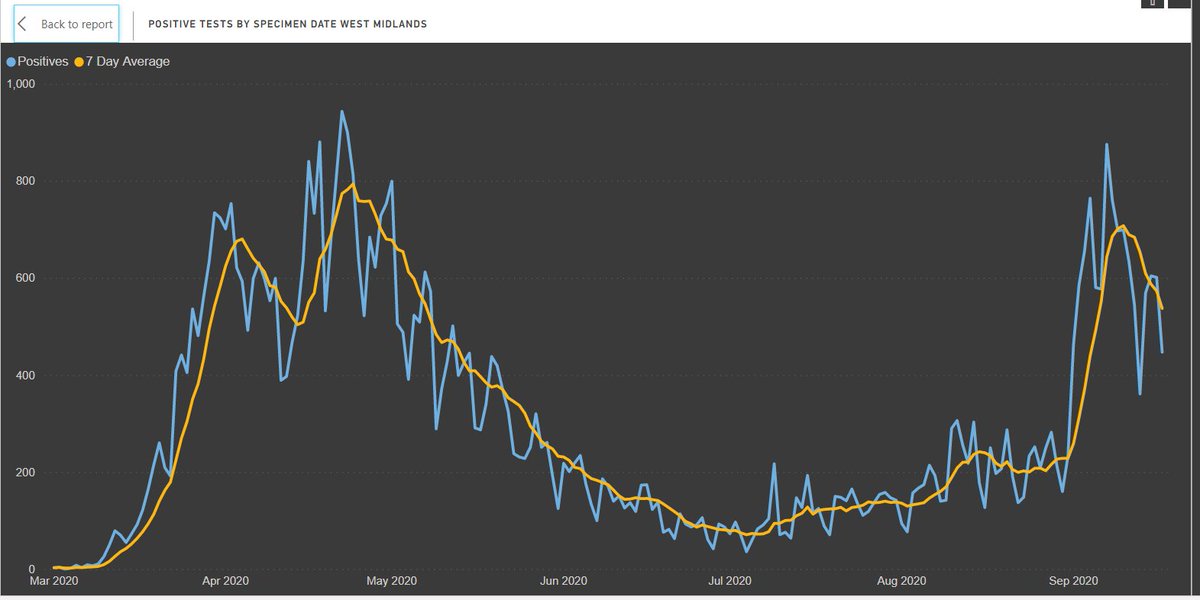
10/ West Midlands

Very steep climb to the 10th then flattens. Just cannot see the backlog of tests being all the way back to the 12th as that would be 7 days. If it is that far then it is a complete shambles

• • •

Missing some Tweet in this thread? You can try to force a refresh
 

Keep Current with datatosee.com

datatosee.com Profile picture

Stay in touch and get notified when new unrolls are available from this author!

Read all threads

This Thread may be Removed Anytime!

PDF

Twitter may remove this content at anytime! Save it as PDF for later use!

Try unrolling a thread yourself!

how to unroll video
  1. Follow @ThreadReaderApp to mention us!

  2. From a Twitter thread mention us with a keyword "unroll"
@threadreaderapp unroll

Practice here first or read more on our help page!

More from @dontbetyet

Dec 22, 2021
1/

A thread on the "presentation" that was given to the cabinet office yesterday.

I hope many of you had questions about this as I sure do. If you had no questions about how this is being presented I really worry.

@EssexPR

assets.publishing.service.gov.uk/government/upl…
2/ S Gene failure

We have three regions here which appear to have very similar % of S Gene failure.

London, South East, East of England. The North West is not too far behind.
3/ London

Yes, but only London. What I mean is why is London the only region to have extensive data on it?

It says it is a document focussing on the Omicron document, not London.

London has had the least cases all summer so a winter rise was inevitable.
Read 13 tweets
Dec 20, 2021
NHS England patients in hospital v People in Mechanically ventilated beds for London

There is a massive drop off in the % due to rise in people in hospital

It took 11 days in 2020 for the large drop to stop increasing.

We are on day 11 in 2021, next few days will say so much! Image
This is what the other regions look like

East of England Image
Midlands Image
Read 8 tweets
Dec 12, 2021
1/

Deaths within 28 days of a positive test.

There are less deaths this year than last year? Yes

The vaccine therefore works? Well here is the interesting part. Why in younger ages is that not the case?

Focus is on day 300+ for this data

10-14 year olds - more deaths 2021
2/

Focus is on day 300+ as this is the "current wave"

15-19 year olds

More deaths 2021 - statistically it is insignificant being a difference of one. But what is significant is there are more in 2021.
3/

20-24 year olds

More deaths in 2021
Read 24 tweets
Dec 10, 2021
No one actually gave a crap about this in 2017

Now you have many wanting to shut the country down for a differently named respiratory disease.

amp-theguardian-com.cdn.ampproject.org/v/s/amp.thegua…
Read 6 tweets
Dec 9, 2021
London is the least vaccinated region in England so to the people who say vaccines are the only thing that will bring cases down have a run through these tell me what you see?

London at the top or bottom?

1/ Ages 0- 19 (5 Year age groups)
2/ 20-39
3/ 40-59
Read 5 tweets
Dec 6, 2021
In the past 10 weeks there have been 12 more deaths in 10-14 year old males than the previous year.

In Females there has been one more than last year.
In 15-19 Males there have been 35 more deaths this year than last year.

In Females there have been 9 Less
In 20-24 year olds there have been 24 more deaths this year in Males compared to last year.

In Females there have been 23 more deaths.
Read 4 tweets

Did Thread Reader help you today?

Support us! We are indie developers!


This site is made by just two indie developers on a laptop doing marketing, support and development! Read more about the story.

Become a Premium Member ($3/month or $30/year) and get exclusive features!

Become Premium

Don't want to be a Premium member but still want to support us?

Make a small donation by buying us coffee ($5) or help with server cost ($10)

Donate via Paypal

Or Donate anonymously using crypto!

Ethereum

0xfe58350B80634f60Fa6Dc149a72b4DFbc17D341E copy

Bitcoin

3ATGMxNzCUFzxpMCHL5sWSt4DVtS8UqXpi copy

Thank you for your support!

Follow Us!

:(