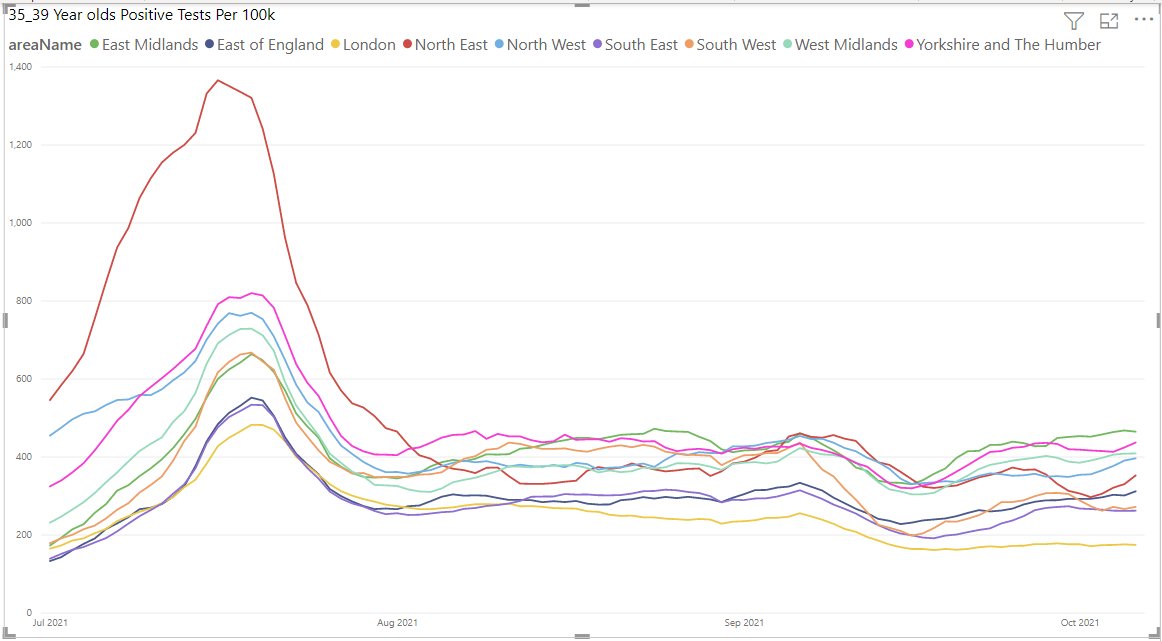
London is the least vaccinated region in England so to the people who say vaccines are the only thing that will bring cases down have a run through these tell me what you see?
London at the top or bottom?
1/ Ages 0- 19 (5 Year age groups) 2/ 20-39
Dec 6, 2021 • 4 tweets • 1 min read
In the past 10 weeks there have been 12 more deaths in 10-14 year old males than the previous year.
In Females there has been one more than last year.
In 15-19 Males there have been 35 more deaths this year than last year.
In Females there have been 9 Less
Dec 4, 2021 • 4 tweets • 1 min read
I will do a full thread next week but here is a little summary to start with.
My Son secondary school aged tested positive 22nd confirmed by PCR.
My sister who has brief contact with him tested positive the same week.
My Daughter was then positive probably on the 25th. 1/
But did a test on her on the 28th which was positive.
Both are both unvaccinated, both are back to normal, daughter got back to normal much quicker.
So what about my double vaccinated wife? What about me being unvaccinated? How have we faired?
2/
Feb 16, 2021 • 9 tweets • 3 min read
Looking at the COVID death rates (PHE) from different counties there are some big drops in the over 90's.
But other age groups are variable depending on the region.
So East of England
Large drops in 85-90 & 90+
80-84 flattening.
East Midlands
85-89 & 90s big drops other groups very variable
Feb 16, 2021 • 5 tweets • 2 min read
COVID-19 hospital admissions round up.
All charts are the daily percentage change in the seven day average.
1- Community admissions
One region South East rose by 1.28%, very big drop in London -9.39% 2/ All admissions England
The decrease has slowed a little bit over the past few days.
Jan 21, 2021 • 6 tweets • 2 min read
COVID-19 Hospital round up, all charts are the daily percentage change in the seven day average. A great measure to filter out daily high / lows - still looking good.
1 - Admissions from the community
2 - All admissions England
Jan 20, 2021 • 5 tweets • 2 min read
Hospital round up, all charts are the daily percentage change in the seven day average. This eliminates high / low days and gives a better longer term view.
1 - Community admissions 2- All Admissions England
Jan 20, 2021 • 7 tweets • 3 min read
1/
People look abroad to say what worked in terms of restrictions and policy but what did did Cambridge do right? If that is the right term, I don't think so.
They have had 55 deaths from a population of 125k they also have high population density 2/ So compare them to Cheltenham who have a lower population and lower density but way more deaths.
Jan 19, 2021 • 5 tweets • 2 min read
COVID-19 Hospital Round up - this does look very promising.
All data is the daily percentage change in the seven day average. 2- All admissions England
Jan 18, 2021 • 4 tweets • 1 min read
Discuss
COVID-19 Deaths for ages 0-4
PHE England = 367
ONS England & Wales = 3
The only logical answer I can come up with is newborn deaths who have tested positive and then died with 28 days. But is not mentioned on the death certificate so not counted in ONS numbers.
I am saying this due to the 5-10 group is 1 ONS and 2 PHE
Jan 14, 2021 • 5 tweets • 2 min read
Hospital COVID-19 round up. All data is the daily % change in the seven day average.
Admissions data to the 12th
In Hospital / Mech Vent beds 14th.
1/ Admissions to hospital from Community. 2/ All hospital admissions
Jan 13, 2021 • 5 tweets • 2 min read
Hospital round up, this is the daily percentage change in the seven day average.
Admissions data to the 11th
In Hosp. / Mech Vent 13th
Ideally we want to see the colours below the blank dashed line.
1/ Community Admissions 2/ All admissions by region
Jan 13, 2021 • 6 tweets • 2 min read
Google mobility data.
Percentage change from baseline, I hate how this data is being abused. Lockdown one, the vast majority of business shut, they had no "COVID Safe" workplaces.
Tradesmen can work, takeaways open etc so why is it a surprise residential is lower?
MCR 2/ Liverpool
Jan 12, 2021 • 5 tweets • 2 min read
Hospital COVID-19 round up. Admissions data to the 10th Jan. In hospital / Mech Vent beds to the 12.
All data is the daily percentage change in the 7 day average.
1/ Admissions from the community by region 2/ All admissions by region
Jan 5, 2021 • 5 tweets • 2 min read
Hospital round up for COVID-19 admissions. All charts are daily percentage change in the seven day average.
1/ Admissions from the community 2/ All admissions by region.
Jan 5, 2021 • 5 tweets • 2 min read
1/ London ONS data, shows since the massive amounts of deaths in April they have been either close or below previous years. December's data should be interesting. 
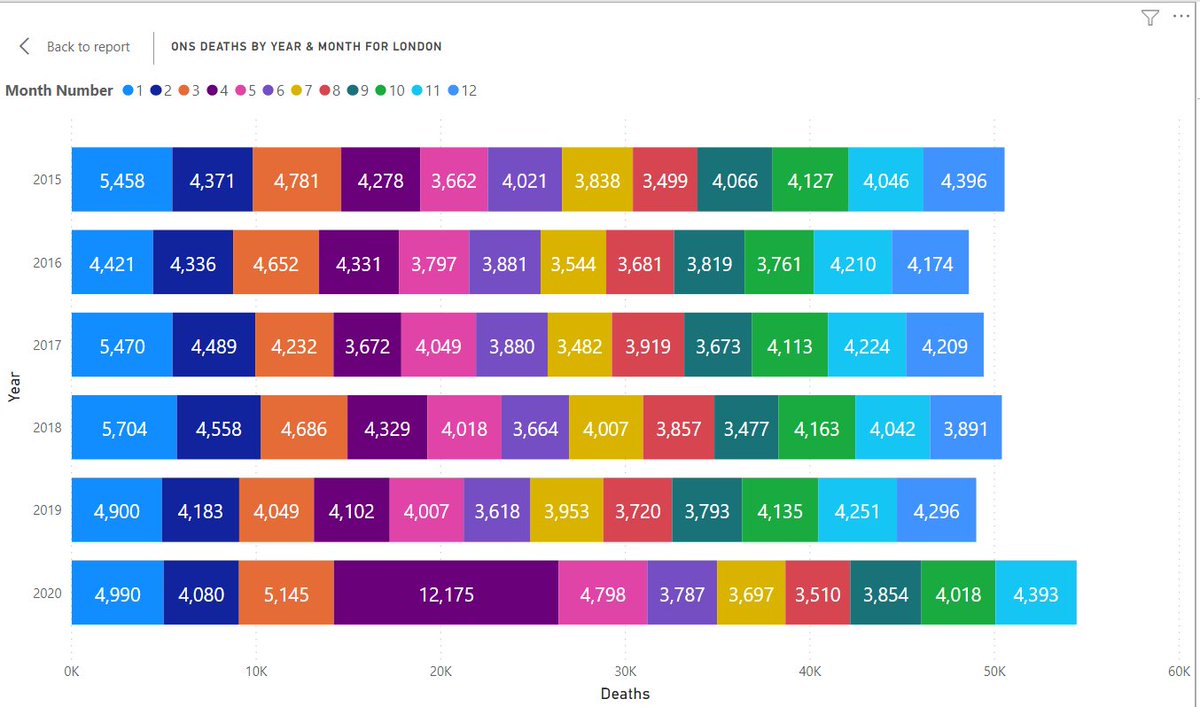
2/ This one puzzles me a bit, Newcastle yes they had increased deaths in Mar / Apr but way lower than London but then similar to other years
Jan 4, 2021 • 4 tweets • 1 min read
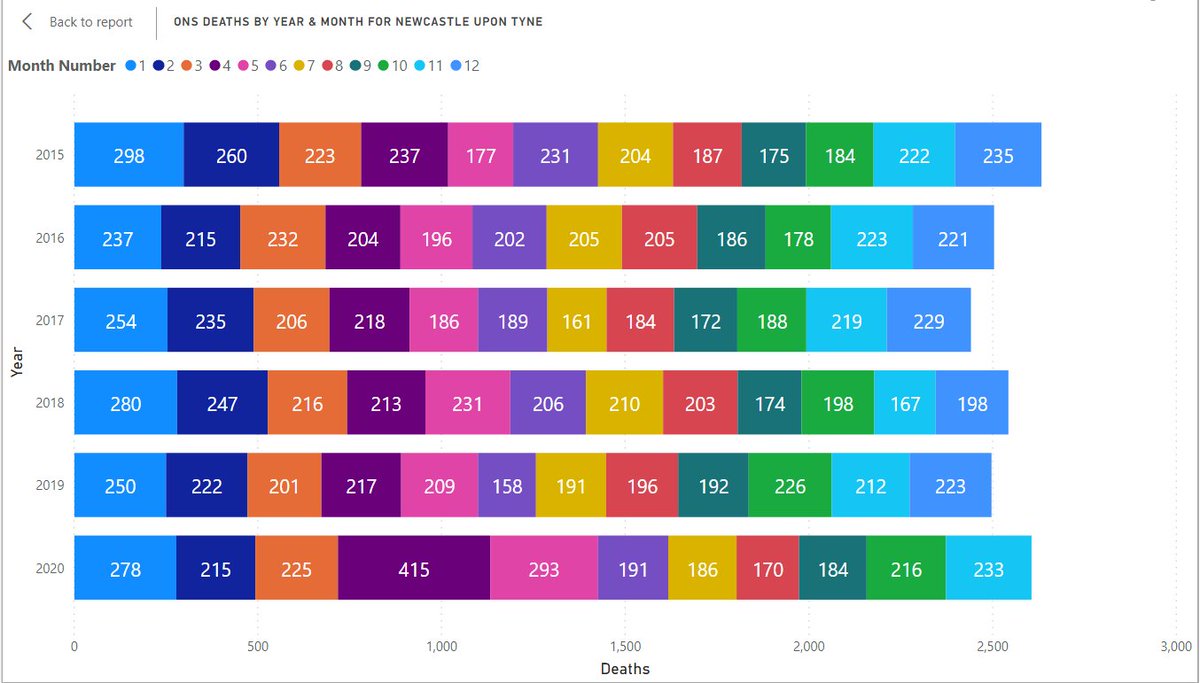
2/ All admissions including people all ready in hospital.