
One of our key pieces of advice is to be careful of confirmation bias.
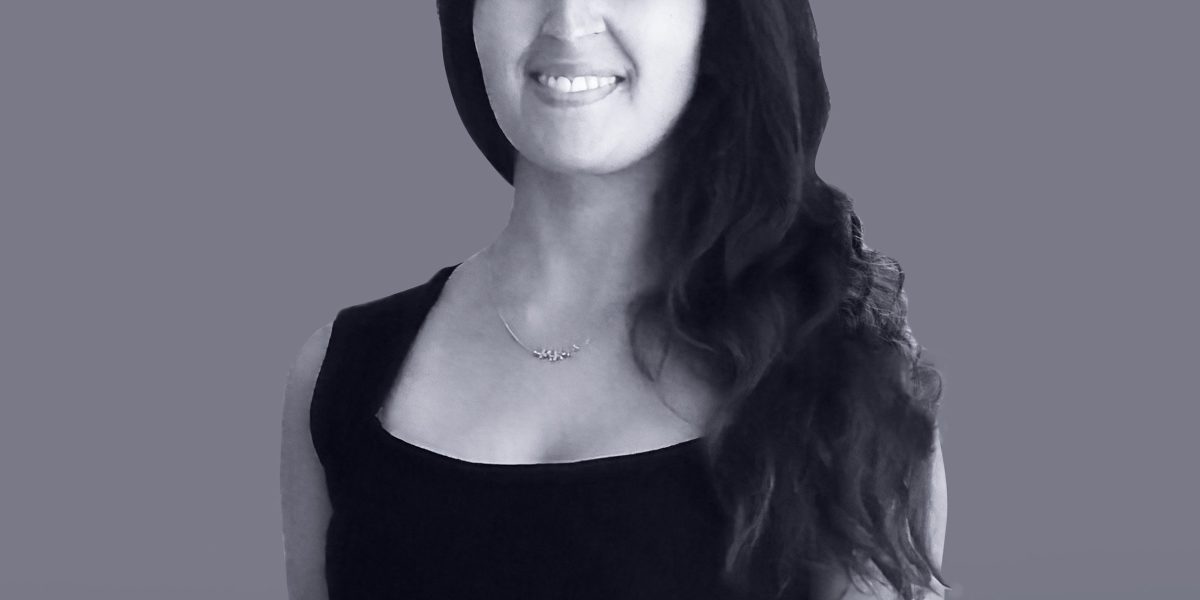
There's a thread going around about how the crop below is what happens when Twitter's use of eye-tracking technology to crop images is fed with data from a misogynistic society. I almost retweeted it. But…
There's a thread going around about how the crop below is what happens when Twitter's use of eye-tracking technology to crop images is fed with data from a misogynistic society. I almost retweeted it. But…

…that story fits my pre-existing commitments about how machine learning picks up on the worst of societal biases. So I thought it was worth checking out.
Turns out, it's not Twitter at all.
Here's the @techreview tweet itself:
Turns out, it's not Twitter at all.
Here's the @techreview tweet itself:
https://twitter.com/techreview/status/1282997462794412032
The picture is provides as a "twittercard", and is provided by the publisher, @techreview, as part of the header in the html file for the article.
Here's the key line in that header. (I've replaced https:// with http*// so that twitter won't reformat.)
http*://wp.technologyreview.com/wp-content/uploads/2020/06/Final-Picture-web_web-e1592394489892.jpg?resize=1200,600
Try it yourself:
wp.technologyreview.com/wp-content/upl…
http*://wp.technologyreview.com/wp-content/uploads/2020/06/Final-Picture-web_web-e1592394489892.jpg?resize=1200,600
Try it yourself:
wp.technologyreview.com/wp-content/upl…

The problem is in the "?resize1200,600" instruction at the end of the URL.
Take this off, you get the full image.
Remember, this part of the html provided by @techreview.
http*://wp.technologyreview.com/wp-content/uploads/2020/06/Final-Picture-web_web-e1592394489892.jpg
Take this off, you get the full image.
Remember, this part of the html provided by @techreview.
http*://wp.technologyreview.com/wp-content/uploads/2020/06/Final-Picture-web_web-e1592394489892.jpg

The fault here is not with twitter at all — it's a careless bit of code on @techreview's part, that just crops the middle blindly out of any image assigned to a twitter card.
This is not to say that machine learning doesn't introduce all kinds of biases, nor to say that twitter's doesn't frustrate us by not allowing users to set their own crop.
It is good lesson, though, in digging deeper before jumping to conclusions that match one's priors.
It is good lesson, though, in digging deeper before jumping to conclusions that match one's priors.
On the other hand, if you haven't seen this, this seems to be a legit case of algorithmic bias on the part of Twitter's cropping algorithm.
Click on each image to see what is going on.
Click on each image to see what is going on.
https://twitter.com/ZackDavisson/status/1307597147206946816
• • •
Missing some Tweet in this thread? You can try to
force a refresh


