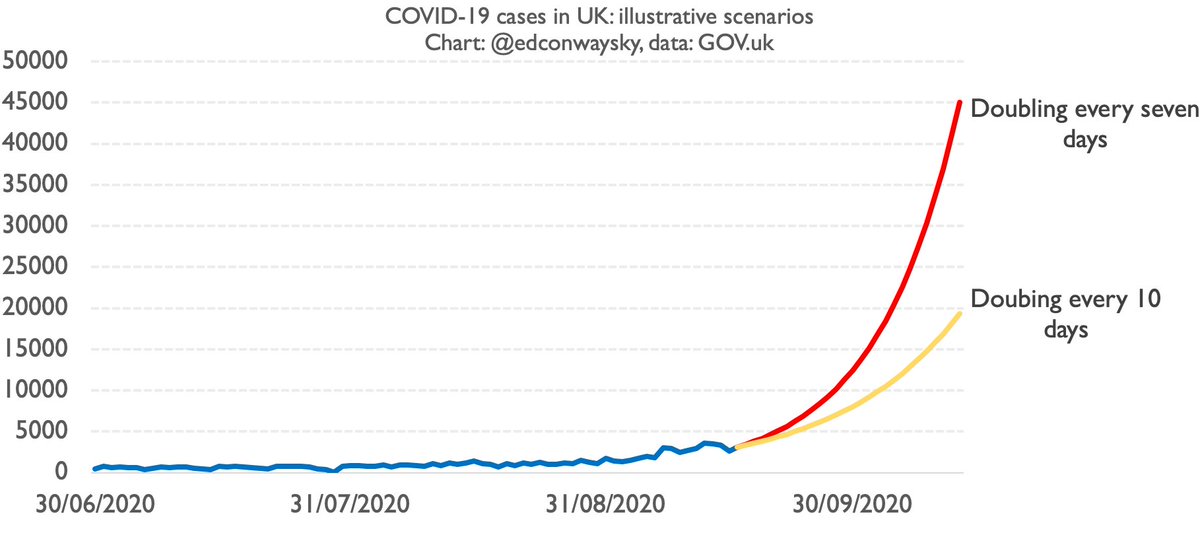
You’ll probably see this chart a lot today. It’s the one @uksciencechief just showed at the @10DowningStreet briefing today. It’s v v scary & implies if the current growth rate of #COVID19 continues we'll face 49k cases a day by mid October. So. Is this really plausible...?
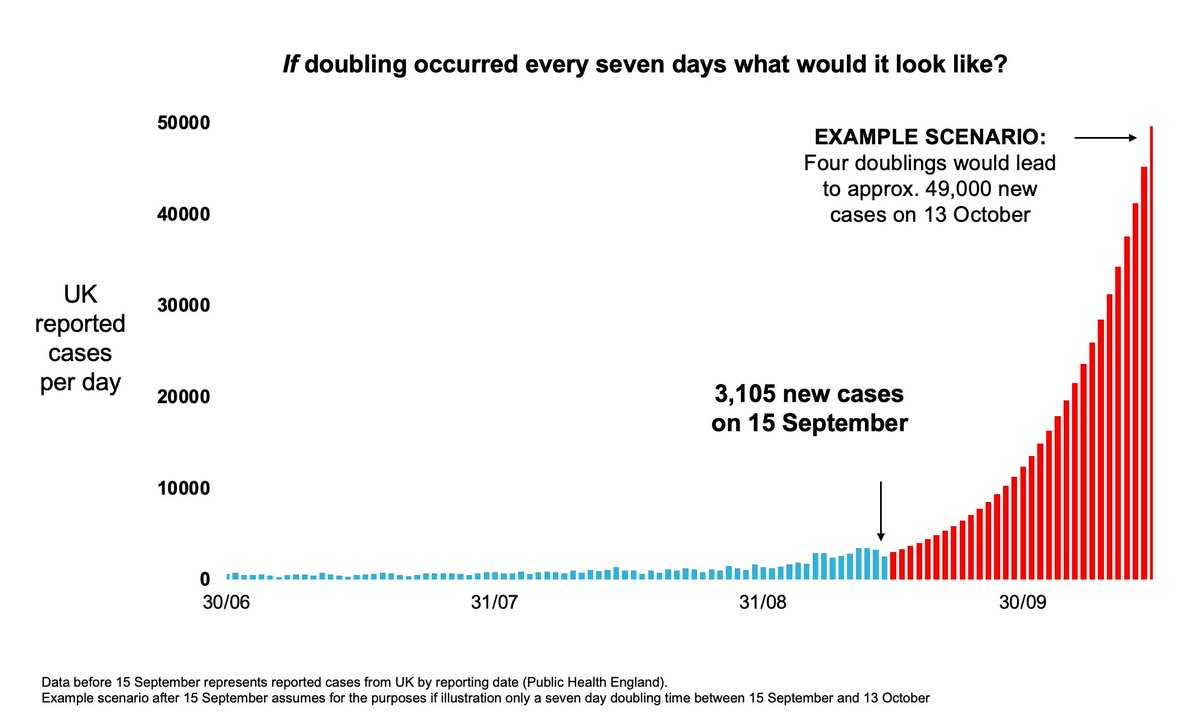
Well in strict mathematical terms, yes it is. Exponential growth rates are scary. This is precisely the problem with diseases like #COVID19. In the first wave deaths were for a time doubling every 3/4 days. Here's what that chart might look like if we followed last wave. Scarier!
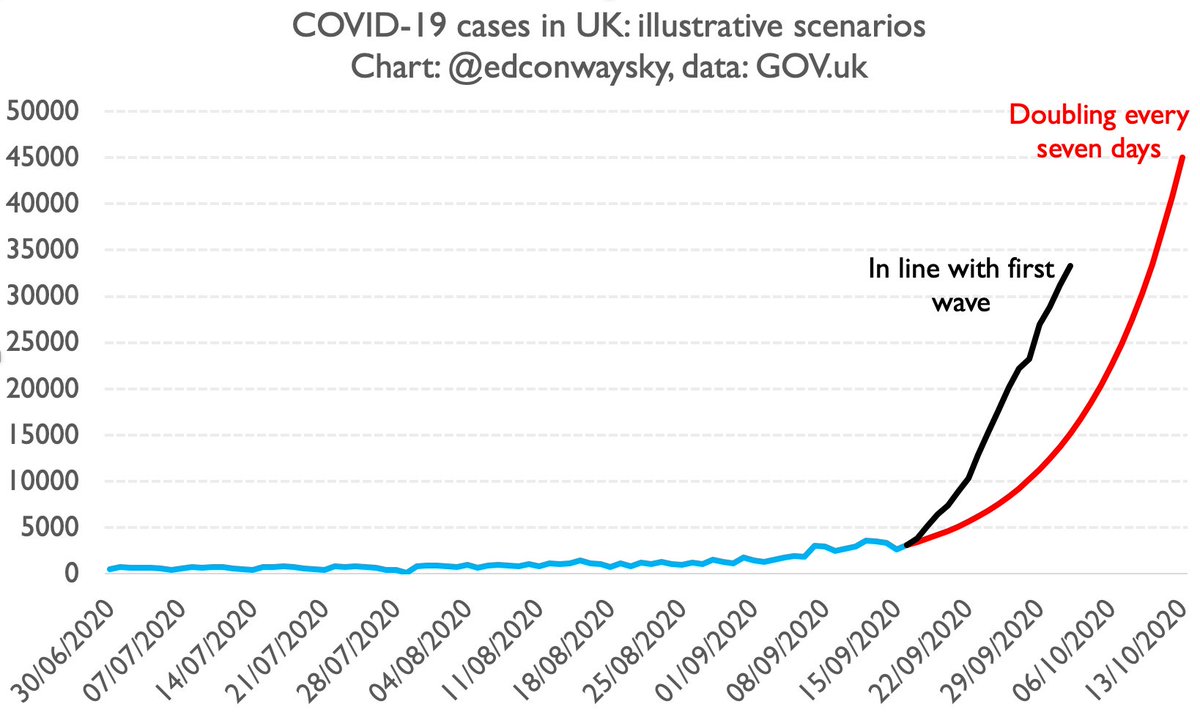
But here's the big problem with @uksciencechief's scary illustrative chart: it's predicated on two presumptions. 1) that we are indeed seeing the disease double every 7 days. 2) it presumes that growth rate will continue. There are quite important challenges to both assumptions.
Let's take 1. first.
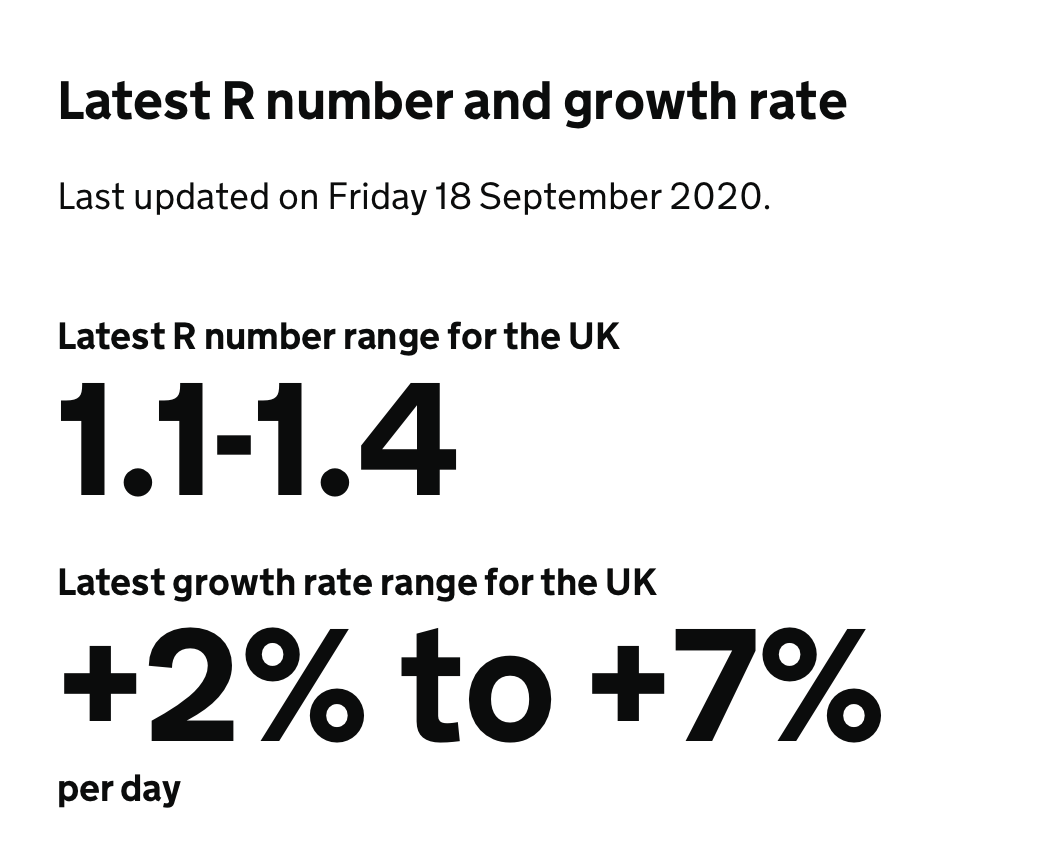
Doubling every 7 days works out at about 10.4% daily growth on average. Yet the govt's own estimate of the disease's growth rate, as per the latest R number release on fri, is 2-7%. Odd. Do they have data they're not telling us about? gov.uk/guidance/the-r…
In an exponential world, smallish differences between % growth rates can make a big difference. Here's doubling every 10 days (yellow) vs doubling every 7 days, as per @uksciencechief's line (red).
Still grim. Up to 20k cases a day by mid Oct. But that's barely HALF the level.
But just as important as q1 (the growth rate) is q2: the assumption the rate will not change over time. As @uksciencechief mentioned in his presentation, the UK is not the only country in Europe facing a rise in #COVID19 cases. There's also France and Spain...
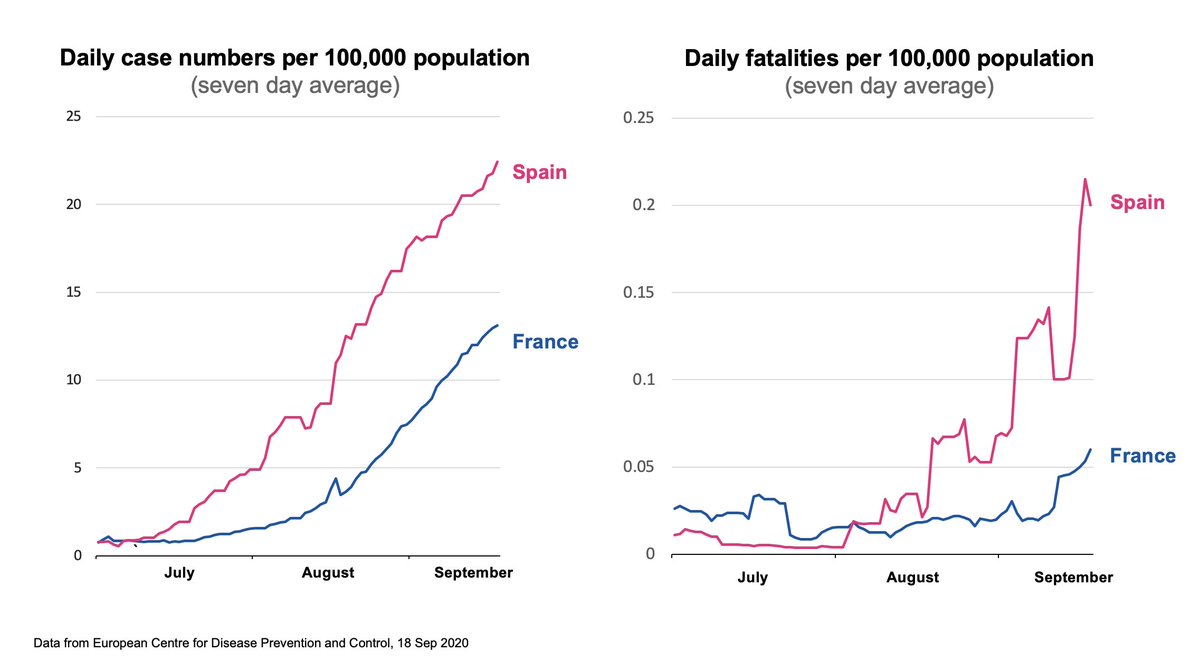
In fact, as I've pointed out a fair few times now, Britain's #COVID19 trajectory this time around is eerily similar so far to what we've seen in both France and Spain. Here's where we are now: about 2/3 weeks behind France/Spain. What happens if that continued?
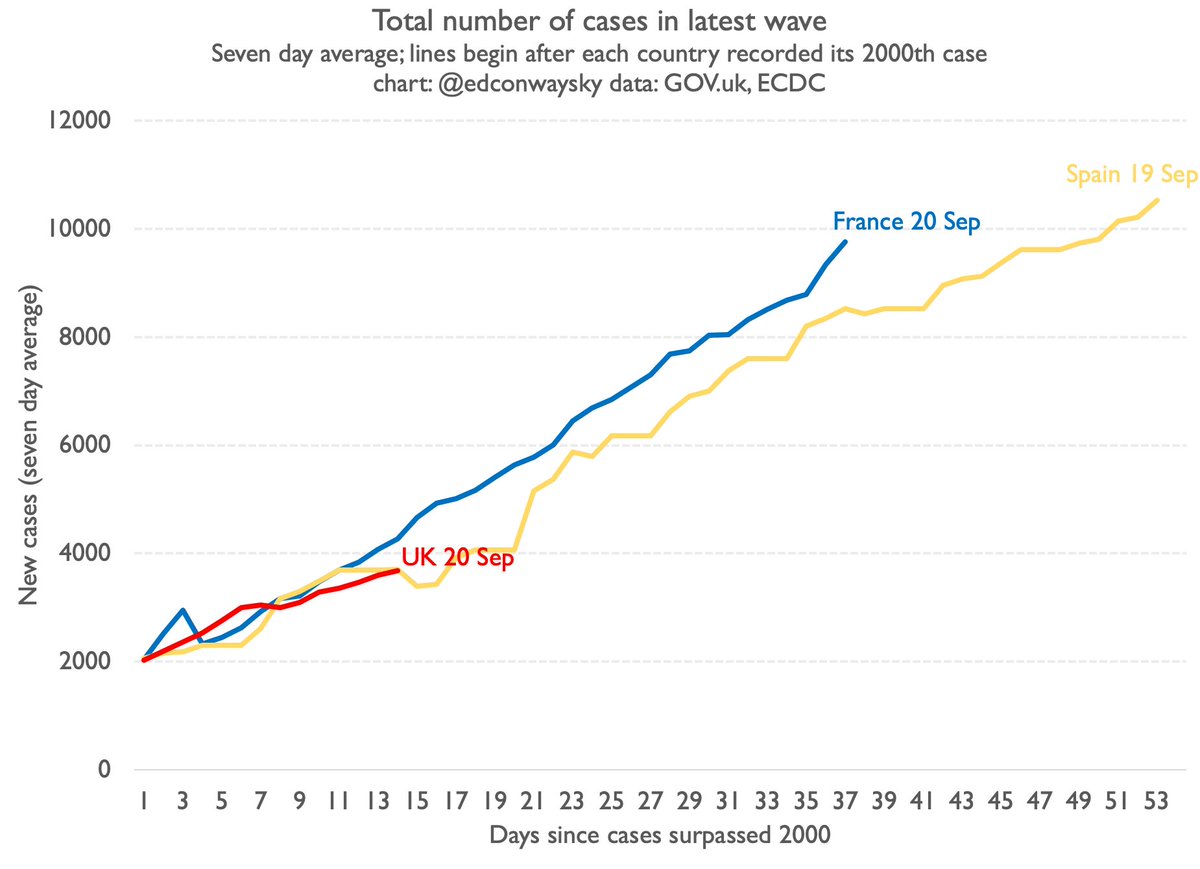
If our #COVID19 growth followed France or Spain (as it has been so far) we'd be at around 10k cases a day by mid October. Not 45k or so.
This is an enormous difference.
10k cases is scary enough. It implies many more deaths & hospitalisations. But 45k cases is way, way worse.
Clearly it's not impossible our case trajectory suddenly leaps as per @uksciencechief's chart. Perhaps he has data we don't have. Though so far there's no sign our trajectory is dramatically different from the ones in France and Spain. If that changes I will of course 🚨
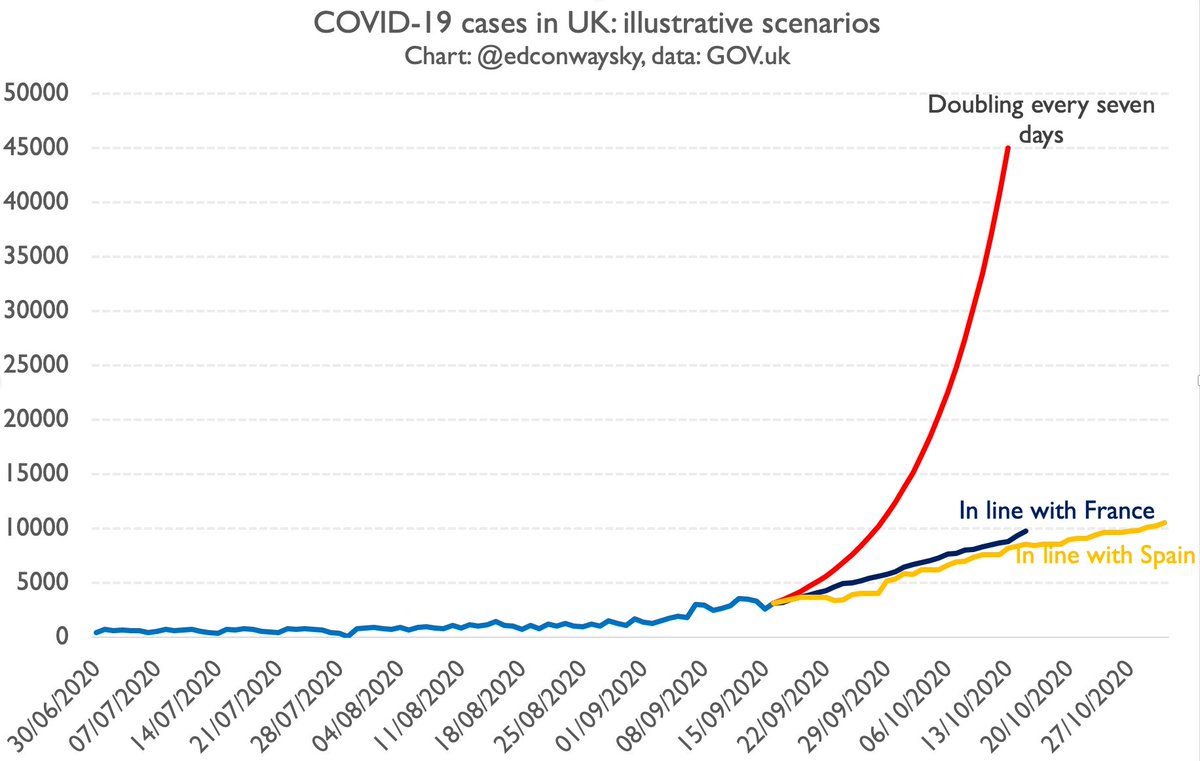
UPDATE: another 4,368 positive #COVID19 cases in the UK in the past 24 hours.
Does that change the overarching picture - that the UK’s cases are following the French/Spanish trajectory - rather than the much steeper illustration from @uksciencechief?
No. Updated chart:
• • •
Missing some Tweet in this thread? You can try to
force a refresh
📽️Is Britain REALLY facing a 1970s-style fiscal crisis?
Why are investors so freaked out about UK debt?
Is this REALLY worse than under Liz Truss?
Who's to blame? Rachel Reeves? The Bank of England?
And would a bit of productivity really solve everything?
📈 Your 6 min primer👇
OK, so let's break it down.
Start with the chart everyone (well, everyone in Whitehall) is talking about.
The 30yr UK government bond yield. Up to the highest level since 1998. And it's still rising.
Does this mean the UK is facing a fiscal crisis? Let's look at the evidence
First let's compare the UK to other G7 countries.
There's two ways to do this.
First, look at absolute levels👇
And it looks pretty awkward for the UK.
Pre-mini Budget we were middle of the pack. That changed post-Truss. And now, under Labour, the UK is even more of an outlier.
👗Billions of pounds of imports...
↗️Rising by more than 50% a year...
🛬Planes stuffed with cheap clothes...
🇨🇳And a loophole saving Chinese companies from £billions of UK taxes.
Behind the scenes of one of the biggest stories in the modern economy: e-commerce
👇
We've spent months investigating this phenomenon.
- We've got the first official estimate of the scale of cheap untaxed imports into the UK.
- We've seen inside the planes carrying these goods here.
- A whole logistics industry is growing around it.
This is a v big deal!
The story begins with a MASSIVE rise in orders from Chinese e-commerce giants like SHEIN and Temu.
Now, most coverage of these brands focuses on labour standards. An important issue.
But there's something else going on here - something deeper.
A shift in how trade works...
🧵Some thoughts re inflation.
Not the data today, but two deep issues we should prob spend more time thinking about. 1. While economists and policymakers may have convinced themselves that the cost of living squeeze is over, for millions of households, it doesn't feel that way.
The key thing to remember here is that when economists talk about inflation what they're really talking about is the ANNUAL RATE at which a basket of goods and services changes price. And certainly, that rate is much lower than the 2022 peaks...
But, as I say, what that number is is simply looking at the difference in the LEVEL of prices over the past year. This chart is that level. (The actual consumer price index!).
And yes, look over the year to May and it's up 3.4%.
🧵Why, barely 24 hours after the Spending Review, is everyone already going on about tax rises?
Are they REALLY coming?
Or is this an "incoherent argument", as one leading minister calls it?
Well here's a thread explaining what's really going on here.
Bear with me...
First things first.
Key thing to remember is that the main job of HMT is to generate enough money, mostly via taxes (left hand bar here), to finance all its spending (right hand bar).
If that left hand bar isn't high enough, we have to borrow to fill the gap.
That's the deficit!
This week's Spending Review was about the right hand column, obvs. But not ALL of the column.
Actually more than half of govt spending is on stuff that WASN'T covered by the spending review - on benefits, debt interest, pensions etc. It's called "annually managed expenditure"
🧵
You may recall a spate of stories a few years ago about appalling working conditions & abysmally low pay in Leicester's clothes factories.
The hope was those stories would shame businesses into improving working conditions.
But here's what ACTUALLY happened next...
👇
Instead of staying in Leicester, most brands abandoned it & shifted production to N Africa & S Asia.
Today Britain's biggest centre of textile & apparel manufacture is battling the threat of extinction.
It's a mostly untold economic story we've spent recent months documenting
Once upon a time Leicester was the beating heart of UK clothes manufacturing.
The city was dotted with factories making clothes for big name brands.
Now, according to one estimate, the number of clothes factories has dropped from 1500 in 2017 to under 100 this year. A 95% fall.
How big a deal is the new trade agreement unveiled between the US and the UK? Here are some initial thoughts.
Start with this: this is total UK exports to the US over the past 5yrs: £273bn. Right now most of this will face a 10% tariff. Some things (eg cars) face 25% extra
Let's break down that total. The biggest chunk is cars. Just under £30bn. That's covered under the agreement. So too are steel/aluminium exports. Much smaller at £2.7bn...
These sectors will benefit from special deals (though much of the detail still remains vague).
Rolls Royce will apparently get tariff free access for its jet engines. That mostly helps Boeing, but also Rolls Royce. Jet engines comprise a surprisingly large chunk of UK exports to the US, about £17.3bn. So let's shade that red too...