This article is deeply problematic for a number of reasons. Wildfire risk increased in western US is due to both climate change and poor forest management, much of which is down to Forest Service aggressively extinguishing fires for nearly a century in forests adapted to burn 1/4
Similarly, traditional logging activities do relatively little to reduce fire risk, as what regrows is often more flammable than mature forests. Best tools we have – thinning small trees and brush combined with controlled burns – are not econ viable for the timber industry 2/4
Traditional environmentalists are not without blame here; we need to ensure that pre-commercial thinning and controlled burns are not unduly restricted by environmental regulations. But laying our entire history of poor forest management at their feet is extremely misleading. 3/4
With all the July model runs now in, it is very likely that 2026 will see the largest El Niño event since records began in the late 1800s – and potentially by a truly mind-blowing margin. The median estimate is now 3.6C, roughly 0.8C hotter than the prior record (2.75C).
The 2026/2027 El Niño event has already grown faster than any prior events (at least on an ONI basis). Here its observed and projected future evolution compared to the strongest prior El Niño events in recorded history.
Currently 13 out of 14 dynamical models expect a record setting event based on the Niño 3.4 region sea surface temperature anomalies (ONI), with overall odds of a record sitting at 91% across all 667 model ensemble members.
Heat waves are driven by weather patterns but occur on the backdrop of a rapidly warming world. Without climate change the current European heat wave would have been ~3.2 °C (5.8 °F) cooler.
Heat impacts are non-linear, so this higher severity can lead to much greater suffering
Europe has been warming at a much faster rate than the world as a whole: roughly twice as fast as the global average, and 40% faster than the global land average.
This warming has been fastest in the winter months – driven in part by greater absorption of sunlight with less winter snow cover – but has been rapid year-round:
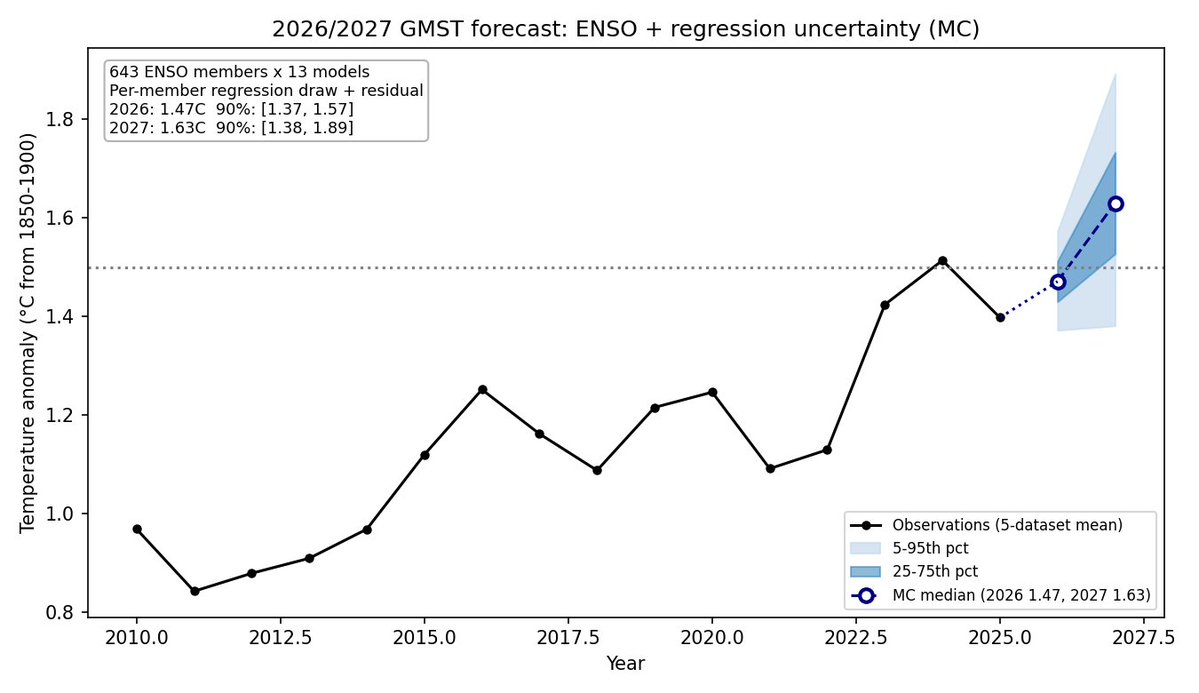
Today the @WMO released projections of where temperatures may end up over the next five years (baed on 13 different models and 250 ensemble members).
Their estimates for 2026 and 2027 are quite close to my (updated) ones:
My 2026 uncertainties are narrower as I'm using the first four months of data for the year to constrain my estimate. I also have a more up-to-date El Nino forecast than the WMO models (which are initialized considerably earlier and don't reflect the likely development of a very strong event.
@WMO I've also updated my estimates using data through April and the latest El Nino forecasts, which slightly bumped up the 2026 and 2027 central values compared to my last estimate that only used data through March: theclimatebrink.com/p/higher-warmi…
The arc of the scenario universe is long, but it bends inevitably toward more realistic emissions.
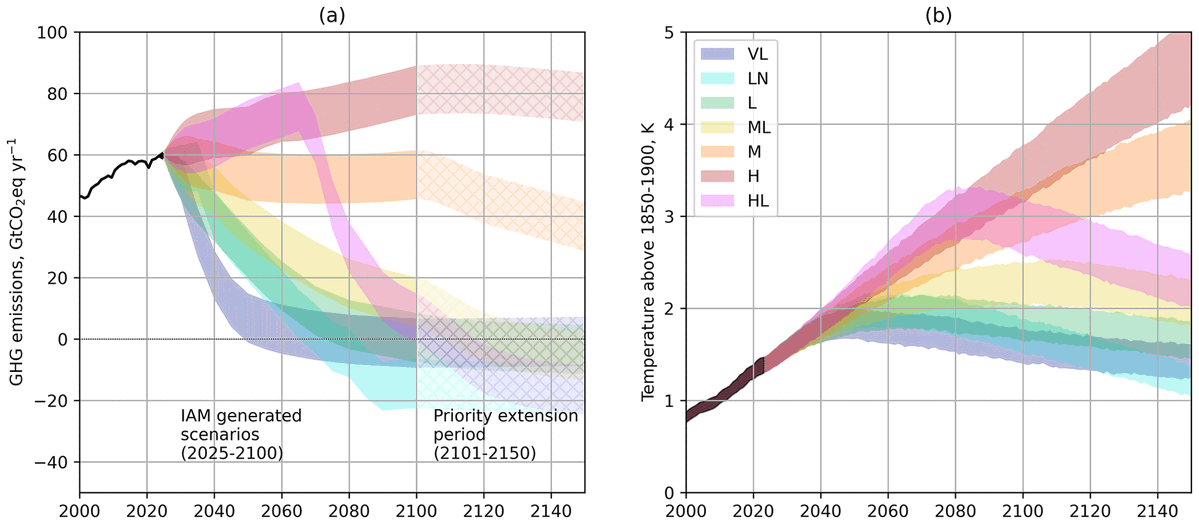
A new paper outlining the emissions scenarios we will be using in the upcoming IPCC AR7 report notes that "the CMIP6 high emission levels (quantified by SSP5-8.5) have become implausible".
It outlines a yet-to-be-released high emissions scenario notably lower than the one (SSP5-8.5) used in the prior IPCC 6th Assessment Report:
This is a change that a number of us in the community have long advocated, going back to Justin Ritchie's work in 2017.gmd.copernicus.org/articles/19/26…
And in 2020 Glen Peters and I published a piece in Nature arguing that high emissions scenarios were no longer "business as usual", and that more realistic emissions make for better climate policy: nature.com/articles/d4158…
El Niño is coming, and it is shaping up to be a big one.
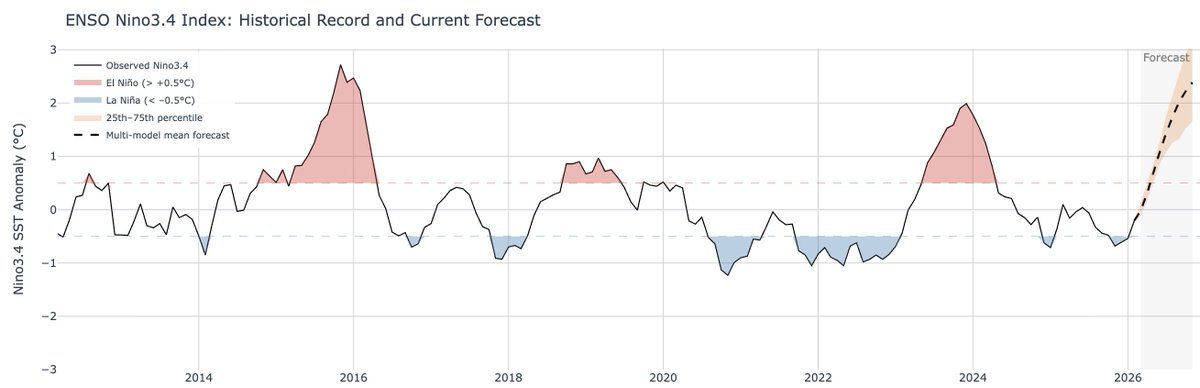
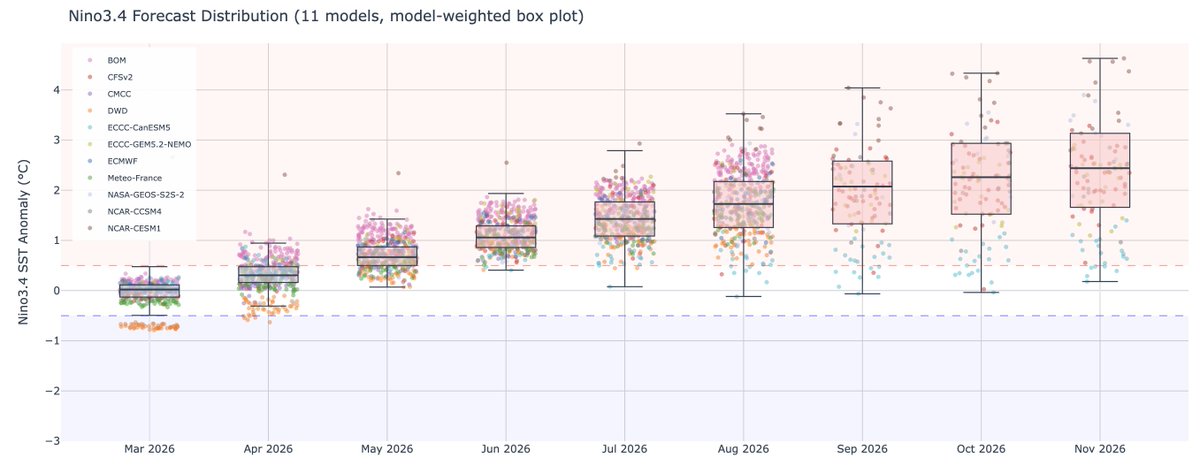
Over at The Climate Brink I've put together a compilation of the latest forecasts by different modeling groups. They suggest that we might see an event comparable in strength to what we saw in 2016.
This is based on a collection of 11 different models (and 455 individual ensemble members) all updated since the start of March. I've put an interactive version of the data up on the Climate Dashboard here: dashboard.theclimatebrink.com/#enso
While there remains a big spread in models (and some models only run through August), more than half the runs show a strong (>1.5C Nino3.4) event developing by August and a very strong event (>2C) by the end of the year.
As a rare climate scientist working in Silicon Valley, I've been drinking from the AI firehose a lot more than my peers. I thought it would be helpful to lay out my experiences of both the promise and pitfalls of using AI to accelerate scientific research.
As a bit of background, I've been working with these tools since late 2022, and seen firsthand how they have dramatically improved over time. I’ve also worked with frontier AI labs to evaluate how well LLMs answer climate questions, and to help enable AI tools to support scientific collaboration.
So what do AI tools do well for scientific work? In short, coding.
Scientists are generally not software engineers. Much of their coding is self-taught, and many struggle with writing code quickly, producing well-documented reproducible code, and fixing errors.