
"A tireless chronicler and commentator on all things climate" -NYTimes. Climate lead @stripe, writer @CarbonBrief, scientist @BerkeleyEarth IPCC AR7 lead author
29 subscribers
How to get URL link on X (Twitter) App

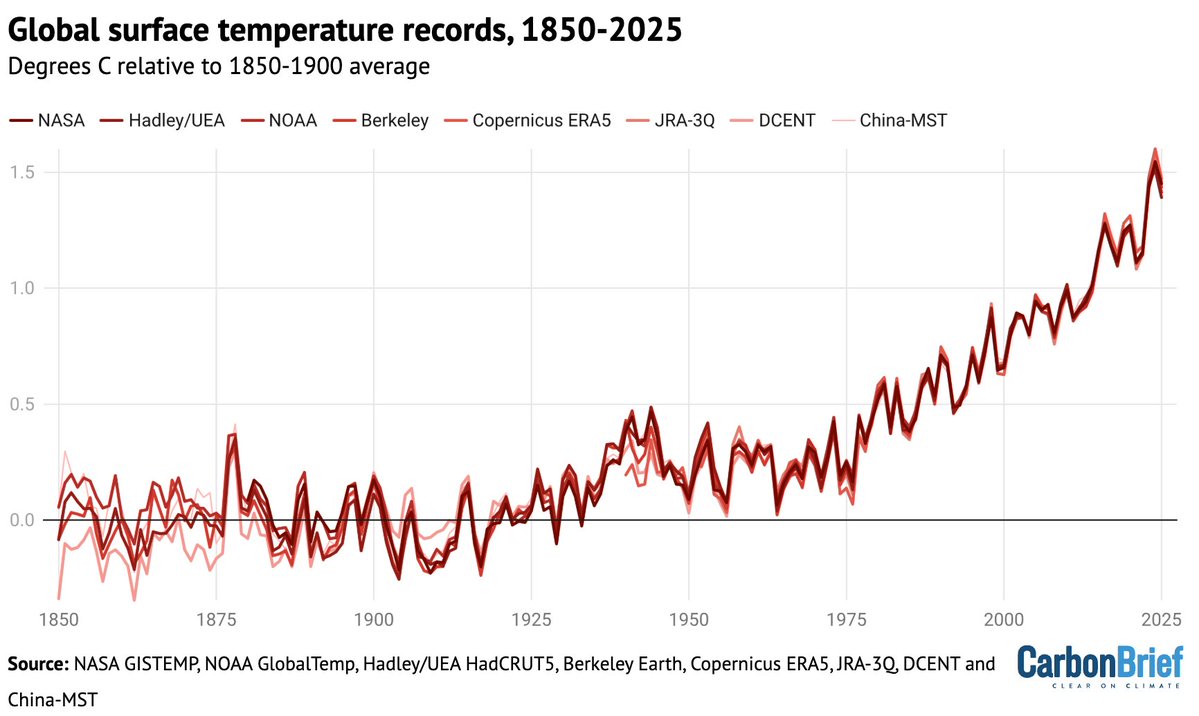
 Read the article here:
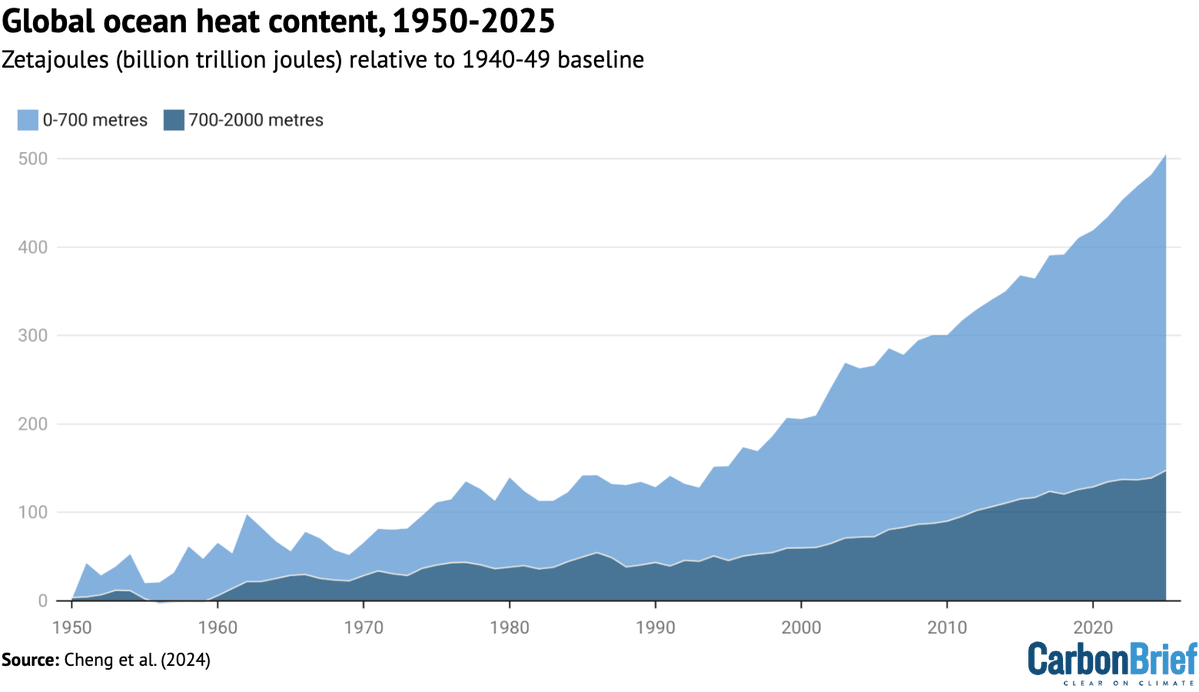

 With 26 days of October now reporting in ERA5, October 2025 will be the third warmest on record after 2023 and 2024.
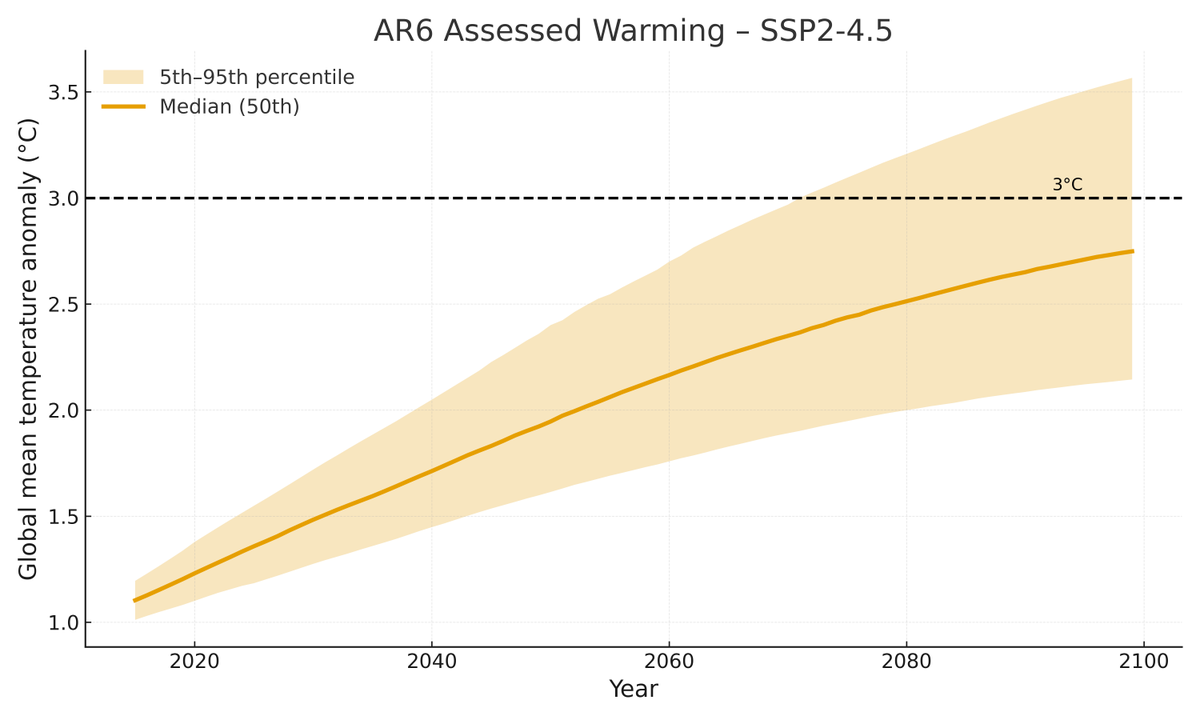
 If we look a the full ensemble of CMIP6 models we see a small number (3 of 37 models) reaching 3C by 2050. However, these three have both too much historical warming (~2.2C in 2024) and what an unrealistically high climate sensitivity (>5C per doubling CO2) as we noted here: nature.com/articles/d4158…
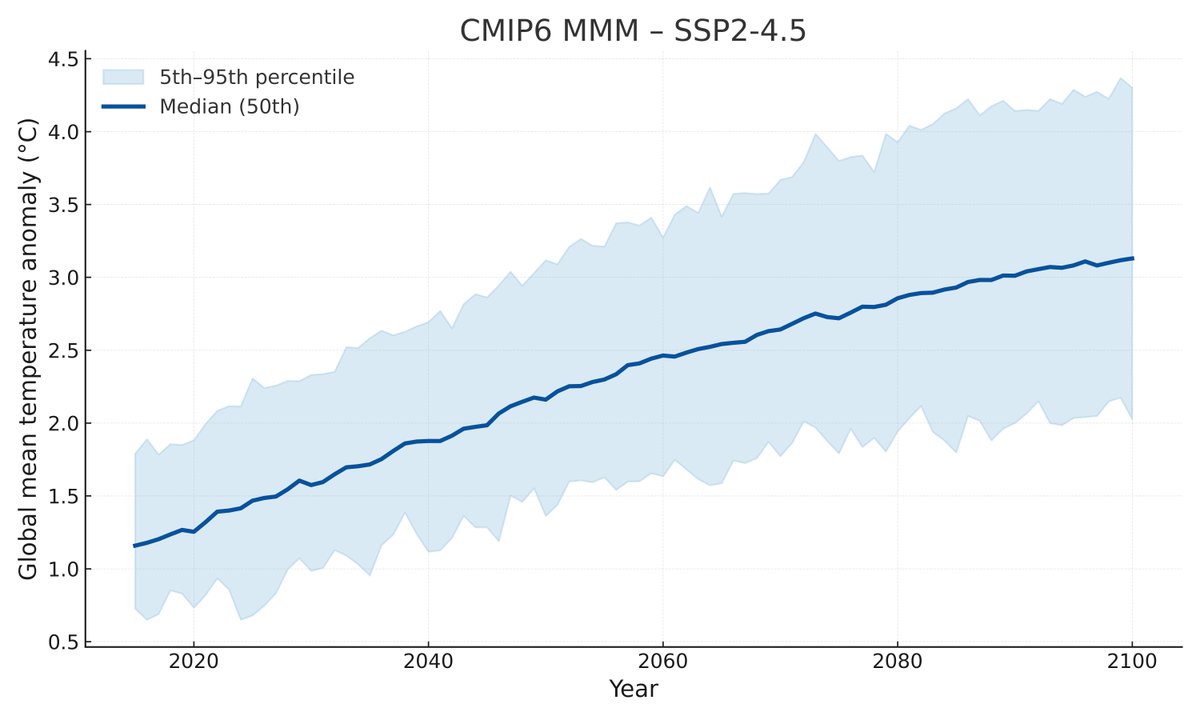

 Specifically, in our paper we argue that RCP4.5 or RCP6.0 are more realistic representations of 2100 warming under current policy than the increasingly implausible RCP8.5 scenario. But the lower of those two – RCP4.5 – gives a 2100 warming range of 1.8C to 4C!

 Human-caused emissions of aerosols – tiny, light‑scattering particles produced mainly by burning fossil fuels – have long acted as an invisible brake on global warming. This is largely because they absorb or reflect incoming sunlight and influence the formation and brightness of clouds.

 Rather than arguing against human influence on the climate, the paper makes the stark claim that "CO2 is the dominant driver of Phanerozoic climate [the past 485 million years], emphasizing the importance of this greenhouse gas in shaping Earth history."
 Why have conditions changed? A legacy of poor forest management has led to fuel loading (particularly in the Sierras), contributing to more destructive fires. But vegetation has also gotten much drier as fire season temperatures have warmed (+3.6F since 1980s)

 This reflects a bit of good news; 2.7C is a lot better than the 4C that many thought we were heading for a decade ago, and reflects real progress on moving away from a 21st century dominated by coal. At the same time, its far from what is needed.

 These falling aerosols have "unmasked" of some of the warming that would have otherwise occurred due to past emissions of greenhouse gases. Its been driven by large declines in Chinese and shipping SO2 emissions over the past decade, among other contributors.

 When we emit a ton of CO2 into the atmosphere, a bit more than half is reabsorbed by the ocean and the biosphere today (though this may change as a warming world weakens carbon sinks). Put simply, 2 tons of CO2 emissions -> 1 ton of atmospheric accumulation.

 Starting 250 years ago, we began putting lots of carbon that was buried underground for millions of years into the atmosphere. All in all we’ve emitted nearly 2 trillion tons of CO2 from fossil fuels, which is more than the total mass of the biosphere or all human structures:

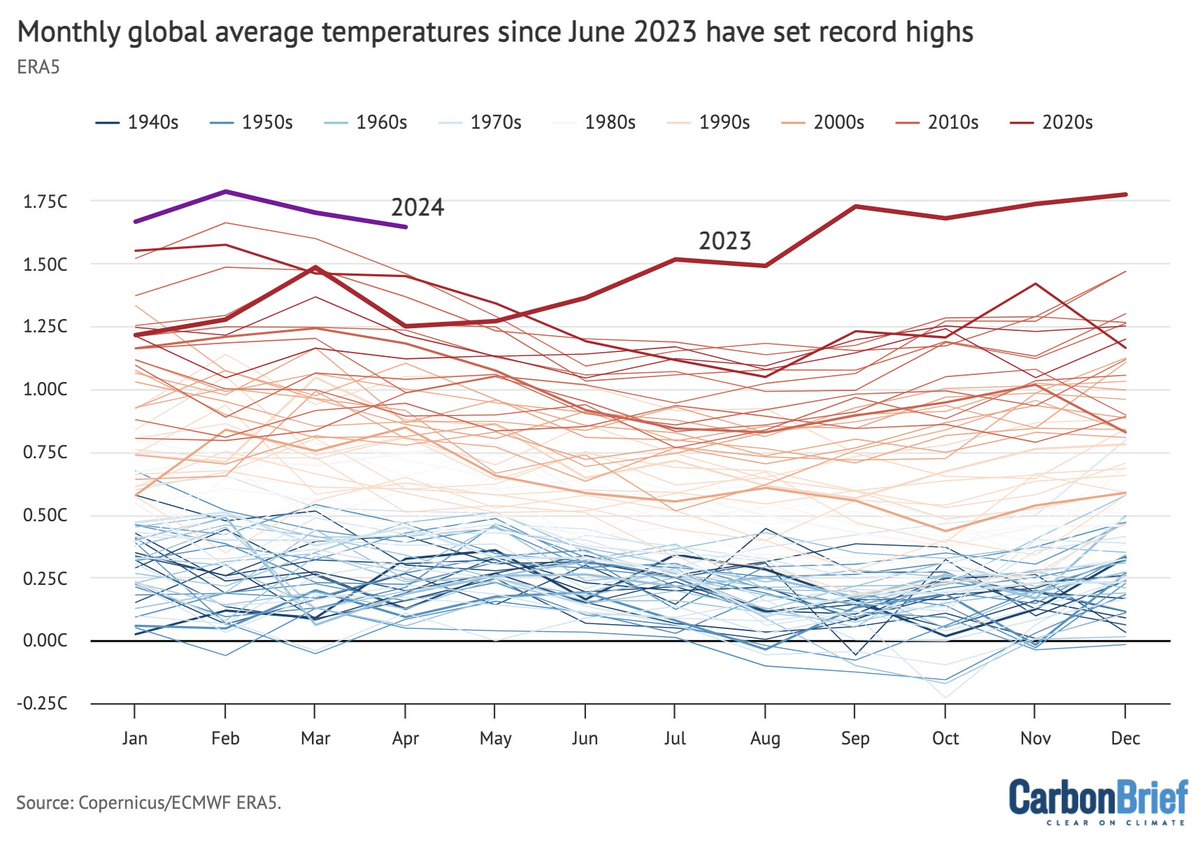
 The past 13 months have each set a new record, with 2024 being quite a bit warmer than 2023 (at ~1.63C above preindustrial levels) in the ERA5 dataset:
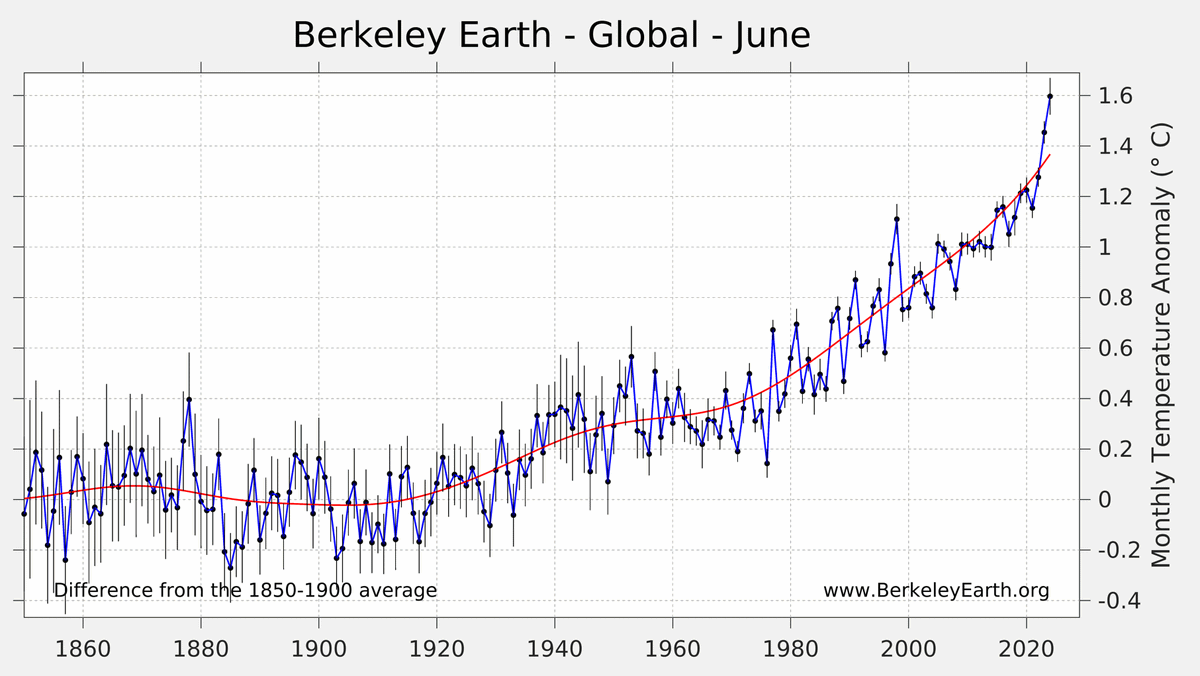
 This was the 13th consecutive record setting month, and the 12th month in a row above 1.5C:
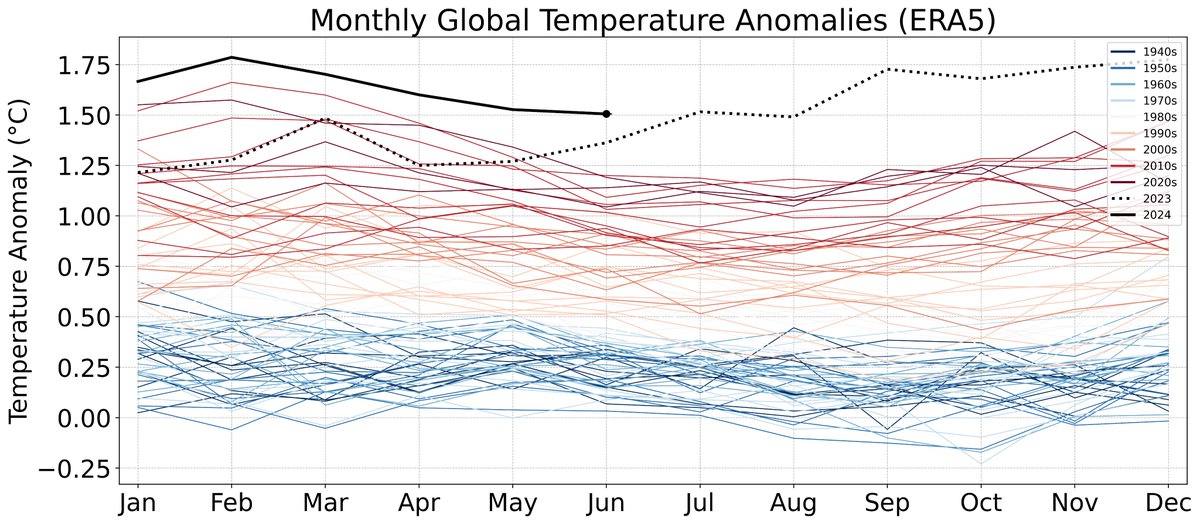
 June 2024 was so warm that – in the absence of 2023's exceptional warmth – it would have beaten any past July as the warmest absolute monthly temperature experienced by the planet in the historical record:


 Global temperatures in any given year reflect short-term natural variability on top of longer-term human-driven warming. For example, a big El Niño or La Niña event can result in global temperatures up to 0.2C warmer or cooler, respectively, than they would otherwise be.

https://twitter.com/cremieuxrecueil/status/1794231057815867807Climate change is driven primarily by our emissions of carbon dioxide. We've emitted a lot of CO2: around 2.5 trillion tons since 1750, or the weight of the the biosphere and everything humans have ever built combined theclimatebrink.com/p/the-staggeri…

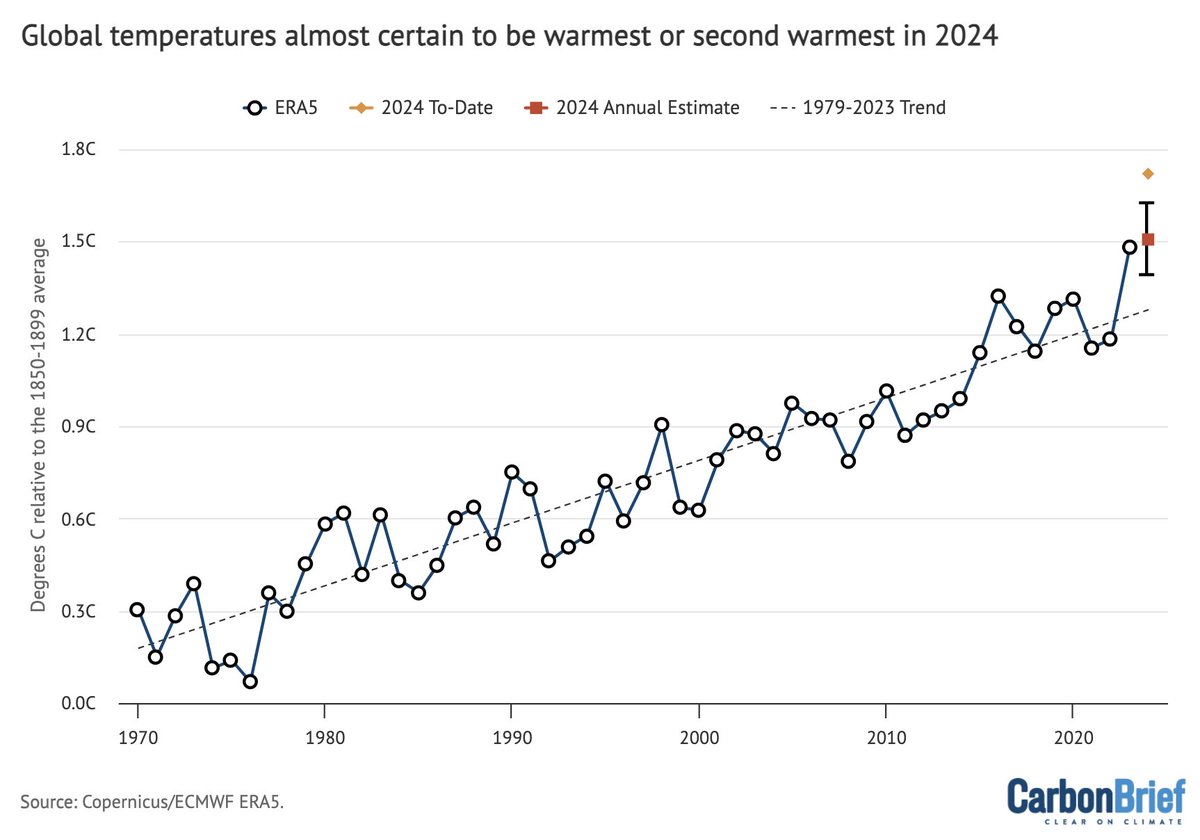
 Based on first three months of the year and the current El Nino / La Nina forecast, we expect 2024 to be similar to or slightly warmer than 2023. With only 3 months in we can't know precisely where the year will end up, but its virtually certain to be at least the 2nd warmest:
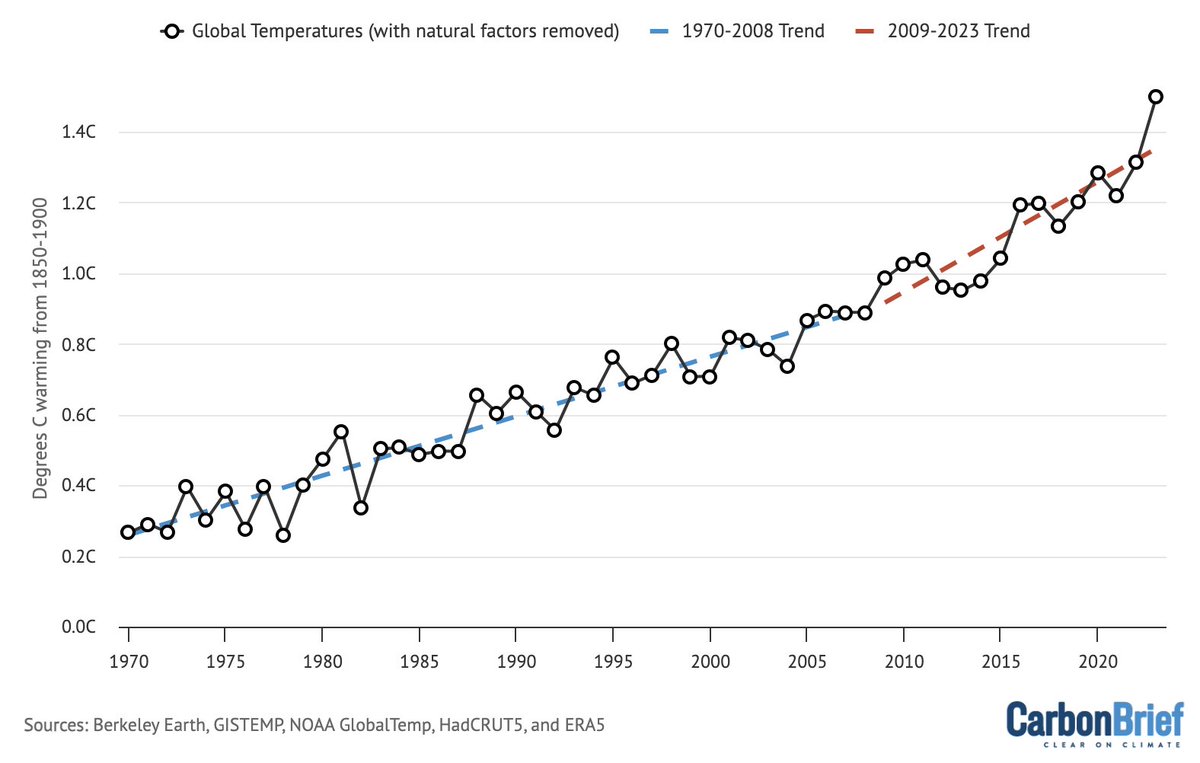
 In a new piece over at @CarbonBrief I compare observed warming (and its historic rate) to three different future projections:

 It wasn't only the warmest February on record – this past month saw the largest anomaly (change from the 1850-1900 preindustrial baseline) at 1.79C of any month on record, beating out December (1.77C) and September (1.73C) 2023.
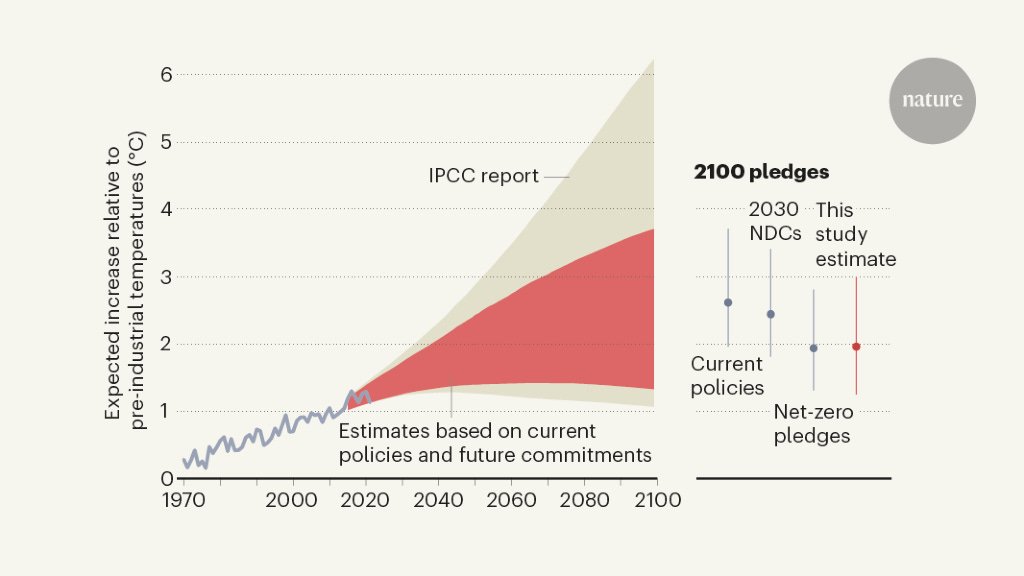
 A decade ago global emissions were skyrocketing, and many thought we were heading toward a particularly dark climate future where the 21st century would be dominated by coal and global emissions would double or triple by 2100.